
Higher June 2023 Paper 1 Q12
12 The cumulative frequency graph shows information about the heights, in centimetres, of 50 plants in a flowerbed.
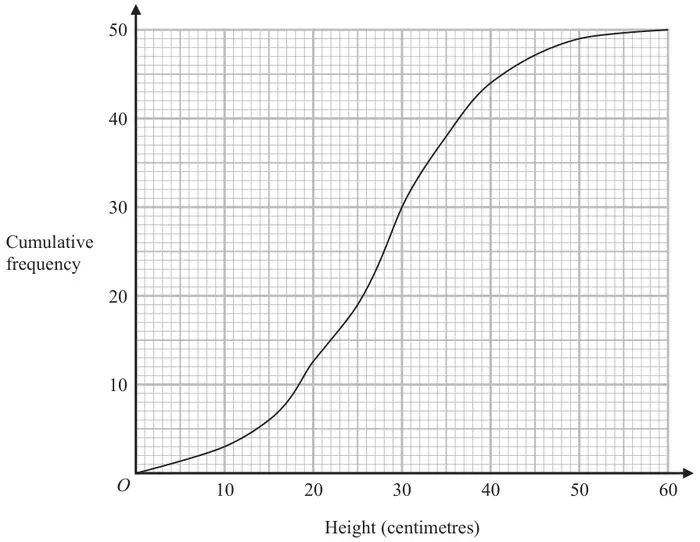
(a) Use the graph to find an estimate for the median height of these plants. (1)
(b) Use the graph to find the frequency for the class interval \(\;30 \lt \text{Height} \leqslant 40\) (1)
(c) Use the graph to find an estimate for the number of plants with a height greater than 35 centimetres. (2)
| Scheme | Marks |
|---|---|
| 28 | B1 |
| (1) |
Notes
B1: allow 27.5 – 28.5
| Scheme | Marks |
|---|---|
| 14 | B1 |
| (1) |
Notes
B1: cao
| Scheme | Marks |
|---|---|
| M1 | |
| Correct answer scores full marks (unless from obvious incorrect working) Answer: 12 | A1 |
| (2) | |
| (4 marks) |
Notes
M1: for a reading of 38 from vertical axis
or 50 – (their reading from a height of 35)
A1: cao