
Higher June 2024 Paper 2R Q11
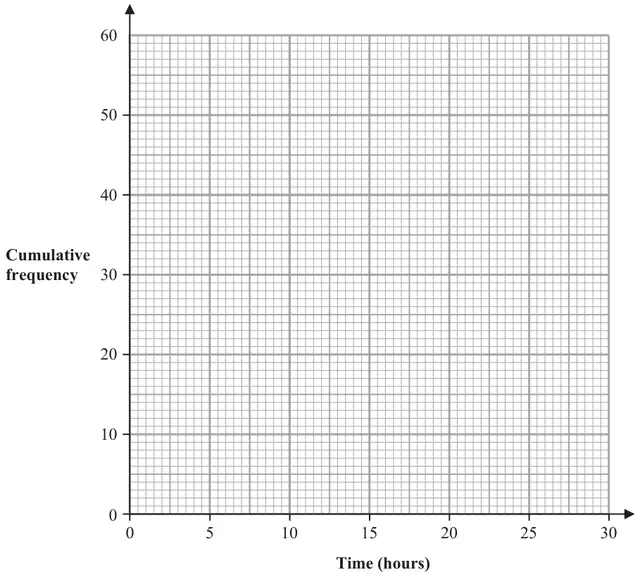
11 The cumulative frequency table gives information about the time, in hours, that each of 60 workers spent working from home in one week.
| Time (\(t\) hours) | Cumulative frequency |
|---|---|
| \(0 \lt t \leqslant 5\) | 6 |
| \(0 \lt t \leqslant 10\) | 17 |
| \(0 \lt t \leqslant 15\) | 27 |
| \(0 \lt t \leqslant 20\) | 42 |
| \(0 \lt t \leqslant 25\) | 53 |
| \(0 \lt t \leqslant 30\) | 60 |
25 workers spent more than \(W\) hours working from home.
One of the 60 workers is chosen at random.
This worker spent \(H\) hours working from home.
| Scheme | Marks |
|---|---|
| USE OVERLAY (NB: a ‘bar chart’ type graph scores zero marks) (ignore any part of the graph before (5, 6)) | B2 |
| (2) |
Notes
B2: for a fully correct cf graph – points at ends of intervals and joined with curve or line segments.
(B1 for 5 correct points plotted and joined
or
B1 for 6 correct points plotted but not joined
or
B1 for 5 or 6 points plotted consistently within each interval (not at upper end) at their correct heights and joined eg plotted at 2.5, 7.5, 12.5, 17.5, 22.5, 27.5
| Scheme | Marks |
|---|---|
| Readings are [8 – 9.5] and [21 – 23] (but for this M1 these do not have to be correct if correct working is shown – eg lines or marks indicating a correct use of CF 15 and CF 45 with an indication on the time axis at the correct points (or they can just show the correct readings)) | M1ft |
| If a graph is drawn, answer is in the given range then award the marks Answer: 11.5 – 13.5 | A1ft |
| (2) |
Notes
M1ft: for a correct method to allow readings to be taken on the time axis from cf 45 (or 45.75) and from cf 15 (or 15.25) oe
ft from their cf graph
A1ft: Accept a single value in the range or
ft from their cf graph
| Scheme | Marks |
|---|---|
| 35 or lines or marks indicating use of CF 35 or an indication on the time axis at the correct point (or they can just show the correct reading) | M1ft |
| If a graph is drawn, answer is in the given range then award the marks Answer: 16.5 – 18.5 | A1ft |
| (2) |
Notes
M1ft: for using or stating 35
(ft from incorrect graph if method shown)
A1ft: ft from their cf graph
| Scheme | Marks |
|---|---|
| \(\dfrac{11}{60}\) | B1 |
| (1) | |
| (7 marks) |
Notes
B1: Accept 0.18(333….) or 18.(333…)%