
Foundation June 2022 Paper 2 Q4
4 The bar chart shows information about the weight, in millions of tonnes, of the potatoes produced by each of four countries in 2016
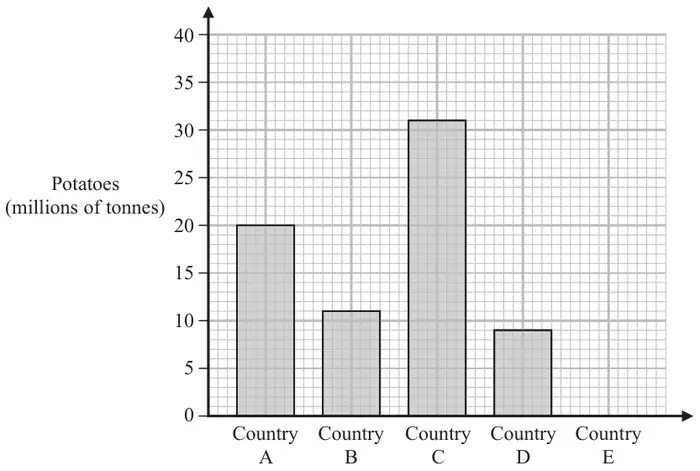
In 2016, one of these four countries produced 11 million tonnes of potatoes.
(a) Which country? (1)
In 2016, Country E produced 7 million tonnes of potatoes.
(b) Draw a bar on the bar chart to show this information. (1)
In 2016, the weight of potatoes produced by Country C was greater than the weight of potatoes produced by Country A.
(c) How many million tonnes greater? (1)
| Scheme | Marks |
|---|---|
| B | B1 |
| (1) |
Notes
B1: Accept b or ‘Country B’ allow incorrect spelling if meaning is clear
| Scheme | Marks |
|---|---|
| bar at height of 7 | B1 |
| (1) |
Notes
B1: any width is acceptable
| Scheme | Marks |
|---|---|
| 11 | B1 |
| (1) | |
| (3 marks) |
Notes
B1: Allow 11 million or 11 000 000 in the answer space