
Foundation January 2019 Paper 1R Q4
4 The bar chart gives information about the volume of fresh water made per day from sea water in each of four countries in 2015
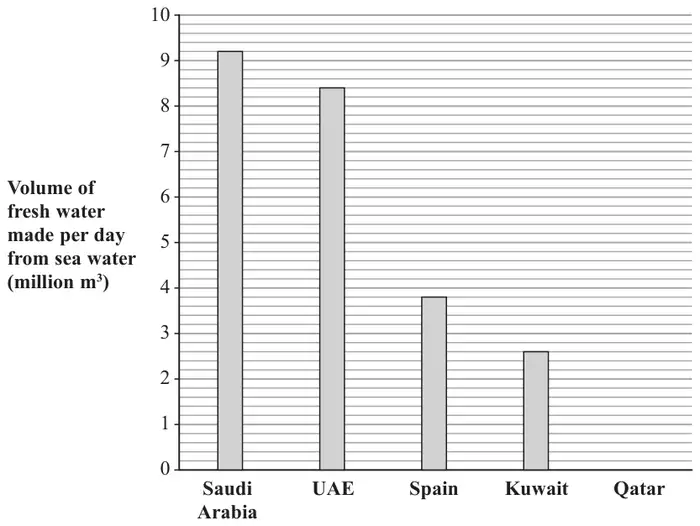
(a) Write down the volume of fresh water made per day from sea water in Saudi Arabia in 2015 (1)
More fresh water was made per day from sea water in the UAE in 2015 than was made per day from sea water in Spain in 2015
(b) How much more? (2)
1.7 million m\(^3\) of fresh water was made per day from sea water in Qatar in 2015
(c) Draw a bar on the bar chart to show this information. (1)
| Scheme | Marks |
|---|---|
| 9.2 | B1 |
| (1) |
| Scheme | Marks |
|---|---|
| 8.4 − 3.8 | M1 |
| 4.6 | A1 |
| (2) |
Notes
M1: At least one correct
| Scheme | Marks |
|---|---|
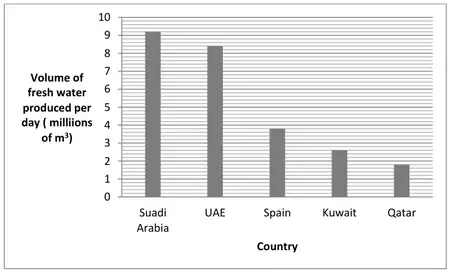 Answer: Bar correct height | B1 |
| (1) | |
| (4 marks) |
Notes
B1: 1.6 - 1.8 drawn