
Foundation January 2020 Paper 1R Q5
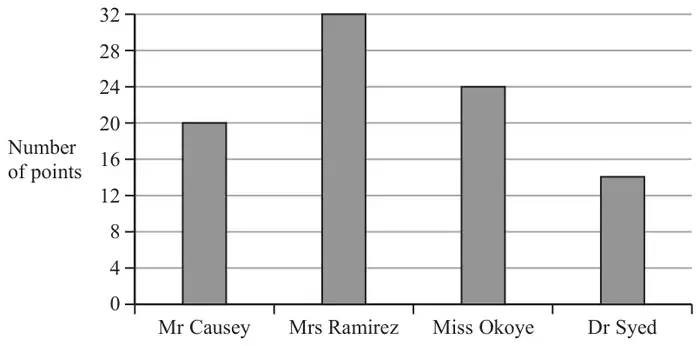
5 The bar chart gives information about the number of points scored by each of four teachers in a quiz.
Joseph starts to draw a pictogram, shown below, for this information.
The pictogram shows the number of points scored by Mr Causey and the number of points scored by Mrs Ramirez.
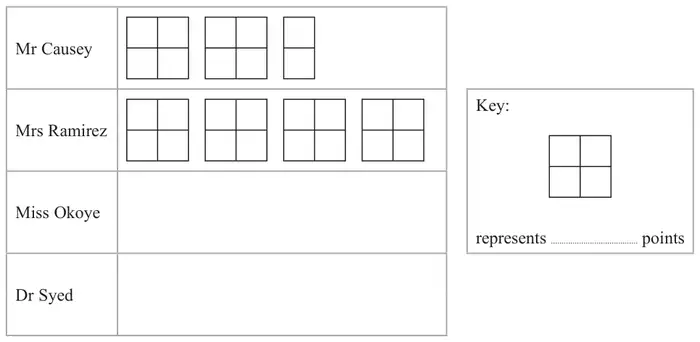
Complete the pictogram, including the key.
(4)
| Scheme | Marks |
|---|---|
| eg 20 ÷ 2.5 (= 8) or 32 ÷ 4 (= 8) or 20 ÷ 10 (= 2) or 32 ÷ 16 (= 2) | M1 |
| 8 | A1 |
| eg 24 ÷ [their 8] or 14 ÷ [their 8] or 24 ÷ [their 2] or 14 ÷ [their 2] | M1 |
| Miss Okoye: 3 whole symbols Dr Syed: 1 whole symbol and three quarters of a symbol 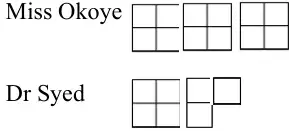 | A1 |
| (4) | |
| (4 marks) |
Notes
M1: for a method to find a key
A1: key completed correctly
M1: complete method to find the picture for Miss Okoye or Dr Syed