
Foundation November 2021 Paper 2 Q1
1 The pictogram shows information about the number of ice creams Sandeep sold on each of four days last week.
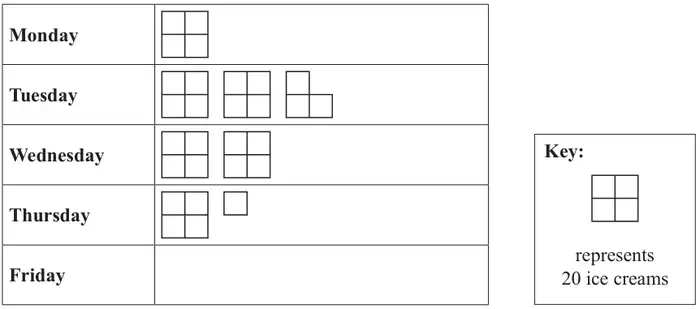
(a) How many ice creams did Sandeep sell on Thursday? (1)
Sandeep sold 30 ice creams on Friday.
(b) Complete the pictogram to show the number of ice creams Sandeep sold on Friday. (1)
(c) On which day was the least number of ice creams sold? (1)
(d) Work out the total number of ice creams Sandeep sold last week. (2)
| Scheme | Marks |
|---|---|
| 25 | B1 |
| (1) |
Notes
B1: cao
| Scheme | Marks |
|---|---|
| 1 and ½ squares | B1 |
| (1) |
Notes
B1: Oe the half symbol can be drawn in any direction.
| Scheme | Marks |
|---|---|
| Monday | B1 |
| (1) |
Notes
B1: M or Mon (allow incorrect spelling if meaning is clear)
| Scheme | Marks |
|---|---|
| 20 + 55 + 40 + ‘25’ + 30 | M1 |
| 170 | A1 |
| (2) | |
| (5 marks) |
Notes
M1: check by side of pictogram for working – allow values without ‘+’ signs if clear attempt to add (allow one error or omission)
A1: cao