
Foundation November 2021 Paper 1 Q3
3 The bar chart shows information about the numbers of text messages that Susan and Philip sent from their mobile phones on each of six days one week.
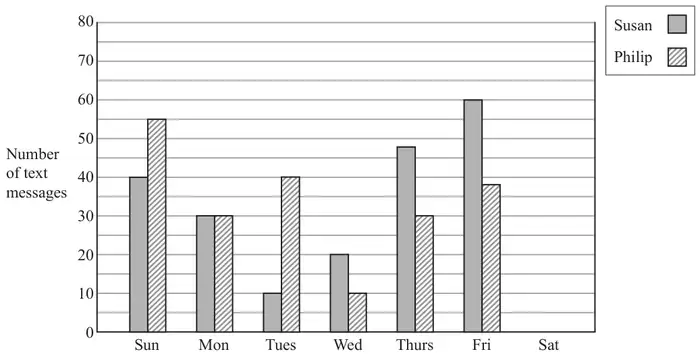
(a) On which day did Susan send twice as many text messages as Philip? (1)
(b) How many text messages did Philip send on Sunday? (1)
On Saturday, Susan sent 15 text messages and Philip sent 40 text messages.
(c) Show this information on the bar chart. (1)
In the following week, Philip sent a total of 180 text messages.
Of these text messages, 25% were sent to Susan.
(d) Work out 25% of 180 (2)
| Scheme | Marks |
|---|---|
| Wednesday | B1 |
| (1) |
Notes
B1: Accept Wed
| Scheme | Marks |
|---|---|
| 55 | B1 |
| (1) |
| Scheme | Marks |
|---|---|
| Correct Bars | B1 |
| (1) |
Notes
B1: Susan 1.5 cm, Philip 4 cm (and having the correct key)
| Scheme | Marks |
|---|---|
| \(\dfrac{25}{100} \times 180\) or \(0.25 \times 180\) or \(180 \div 4\) oe | M1 |
| 45 | A1 |
| (2) | |
| (5 marks) |