
Foundation November 2020 Paper 1 Q2
2 The pictogram shows information about the number of books sold in a shop each day from Monday to Thursday last week.
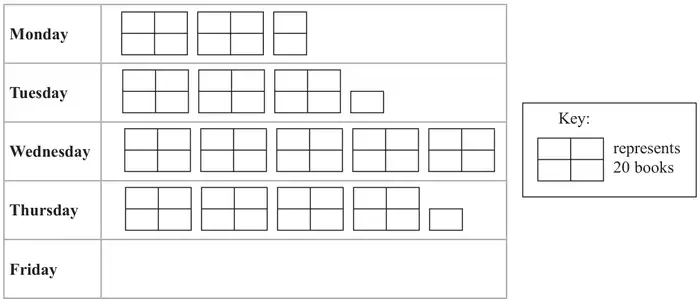
(a) How many books were sold on Wednesday last week? (1)
35 books were sold in the shop on Friday last week.
(b) Show this information on the pictogram. (1)
Last week
- some books were sold in the shop on Saturday
- no books were sold in the shop on Sunday
- a total of 500 books were sold in the shop.
(c) Work out the number of books that were sold in the shop on Saturday last week. (3)
| Scheme | Marks |
|---|---|
| 100 | B1 |
| (1) |
| Scheme | Marks |
|---|---|
| 1 ¾ pictures | B1 |
| (1) |
| Scheme | Marks |
|---|---|
| 2½ + 3¼ + 5 + 4¼ + ‘1¾’ (= 16¾) oe or 2½ × 20 + 3¼ × 20 + 5 × 20 + 4¼ × 20 + 35 (= 335) or 50 + 65 + 100 + 85 + 35 (= 335) | M1 |
| 500 – ‘16¾’ × 20 oe or 500 – ‘335’ | M1 |
| 165 | A1 |
| (3) | |
| (5 marks) |
Notes
M1: ft from (b) for adding up the number of squares or finding the total number of books – allow one error or omission
M1: ft