
Higher November 2021 Paper 3 Q21
21 Here is a speed-time graph showing the speed, in metres per second, of an object \(t\) seconds after it started to move from rest.
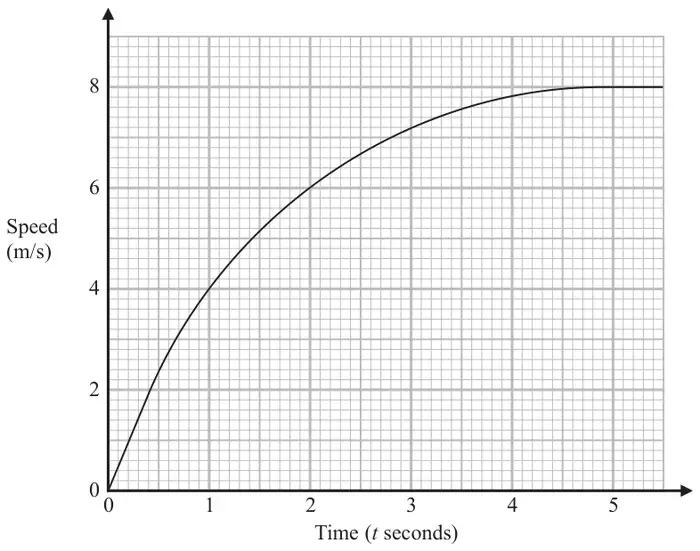
(a) Using 3 trapeziums of equal width, work out an estimate for the area under the graph between \(t = 1\) and \(t = 4\) (3)
(b) What does this area represent? (1)
| Answer | Mark | Mark scheme |
|---|---|---|
| 19.1 | M1 | for a method to find an estimate for the area of at least 1 trapezium under the curve eg \(0.5 \times 1 \times (4 + 6)\) or \(0.5 \times 1 \times (6 + 7.2)\) or \(0.5 \times 1 \times (7.2 + 7.8)\) |
| M1 | for a complete method eg \(0.5 \times 1 \times (4 + 6) + 0.5 \times 1 \times (6 + 7.2) + 0.5 \times 1 \times (7.2 + 7.8)\) or \(0.5\{(4 + 7.8) + 2(6 + 7.2)\}\) | |
| A1 | cao |
Additional guidance
Allow a maximum of 2 errors in \(y\) values used
Ignore any reference to units
| Answer | Mark | Mark scheme |
|---|---|---|
| Statement | C1 | eg distance (travelled) |
Additional guidance
If units are given they must be correct