
Higher November 2021 Paper 2 Q9
9 The box plot shows information about the length of time, in minutes, some people waited to see a doctor at a hospital on Monday.
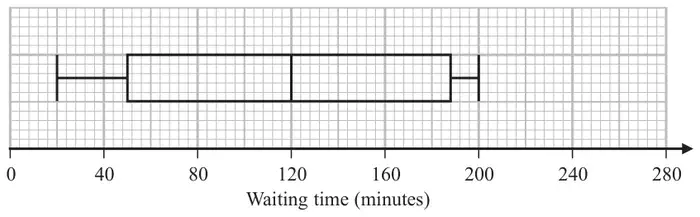
(a) Work out the interquartile range of the information in the box plot. (2)
Becky says,
“50% of the people waited for at least 2 hours.”
(b) Is Becky correct?
Explain why. (1)
Explain why. (1)
The table gives information about the length of time, in minutes, some people waited to see a doctor at the same hospital on Tuesday.
| Waiting time (minutes) | |
|---|---|
| Shortest time | 20 |
| Lower quartile | 50 |
| Median | 100 |
| Upper quartile | 140 |
| Longest time | 210 |
Becky was asked to compare the distribution of the lengths of times people waited on Monday with the distribution of the lengths of times people waited on Tuesday.
She wrote,
“People had to wait longer on Tuesday than on Monday.”
(c) Give one reason why Becky may be wrong. (1)
| Answer | Mark | Mark scheme |
|---|---|---|
| 138 | M1 | for upper quartile = 188 or lower quartile = 50 or an indication that they are trying UQ – LQ |
| A1 | cao |
Additional guidance
Could be written on the grid
| Answer | Mark | Mark scheme |
|---|---|---|
| Yes, with reason | C1 | Yes, with reason Acceptable examples Yes, because the median is at 2 hour (120 min) Yes, since 50% is at the 2 hour mark Yes, because the middle is at 2 hours Not acceptable examples No ….. The median is at the 2 hour mark Yes, because 50% is exactly half way between “188” and “50” |
| Answer | Mark | Mark scheme |
|---|---|---|
| statement | C1 | Acceptable examples The median is lower on Tuesday (higher on Monday) The upper quartile is lower on Tuesday (higher on Monday) There may just have been one person waiting for 210 mins We don’t know how many people were waiting for each time Not acceptable examples The range is bigger for Tuesday (smaller for Monday) The IQR is smaller for Tuesday (bigger for Monday) |
Additional guidance
| M | T | |
|---|---|---|
| Shortest time | 20 | 20 |
| Lower quartile | 50 | 50 |
| Median | 120 | 100 |
| Upper quartile | 188 | 140 |
| Longest time | 200 | 210 |
| Range | 180 | 190 |
| IQR | 138 | 90 |