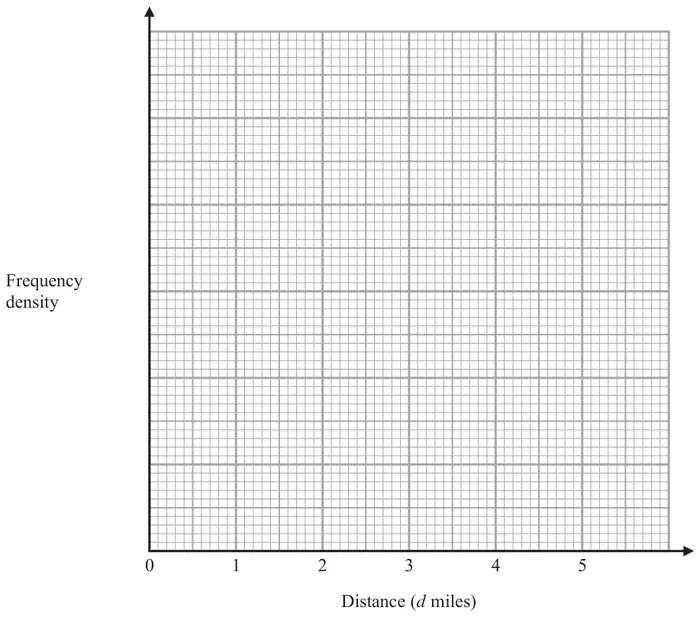
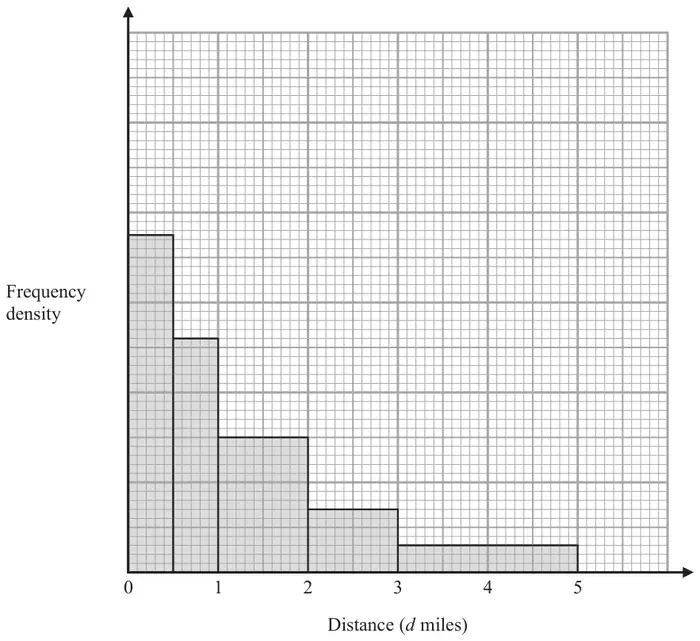
for 4 correct bars or for frequency \(\div\) class interval for all 5 frequencies and 2 correct bars of different widths)
(B1
for 2 correct bars of different widths or for frequency \(\div\) class interval for at least 3 frequencies)
Mark scheme (b)
Answer
Mark
Mark scheme
\(0.4n\)
M1
for finding ratio of heights or widths of bars, eg \(5 : 1\) or \(\dfrac{1}{5}\), \(1 : 2\) or \(\dfrac{n}{5}\) oe or \(2n\) oe as answer or compares areas of bars, eg 6 and 2.4 or 3 and 1.2 or 150 and 60
A1
for \(0.4n\) oe
Additional guidance
Evidence for this mark may be seen on the diagram Any 2 numbers in the ratio \(2.5 : 1\) score M1