
Higher June 2022 Paper 1 Q14
14 Here is a speed-time graph.
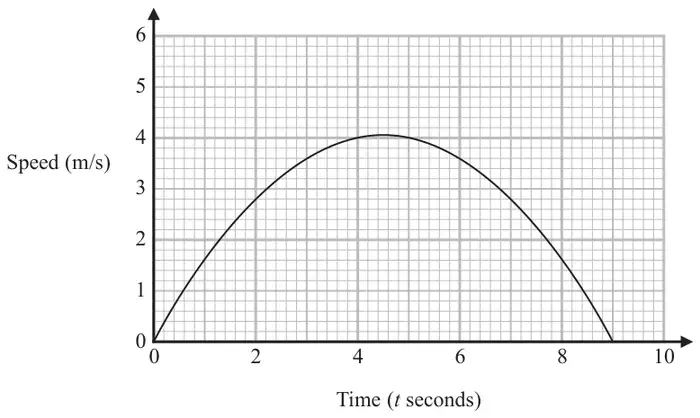
(a) Work out an estimate of the gradient of the graph at \(t = 2\) (3)
(b) What does the area under the graph represent? (1)
| Answer | Mark | Mark scheme |
|---|---|---|
| 0.9 | M1 | for drawing a tangent at \(t = 2\) |
| M1 | for a complete method to find the gradient eg tangent at \(t = 2\) and \(\text{``}2.7\text{''} \div \text{``}3\text{''}\) | |
| A1 | for answer in the range 0.7 to 1.1 |
Additional guidance
Use of change in \(y\) over change in \(x\)
Working may be seen on the diagram
Accept answers in the form \(\dfrac{a}{b}\) where \(a\) and \(b\) are integers
| Answer | Mark | Mark scheme |
|---|---|---|
| Statement | C1 | eg distance (travelled) |
Additional guidance
If units are given they must be correct