
Higher June 2019 Paper 2 Q14
14 A car moves from rest.
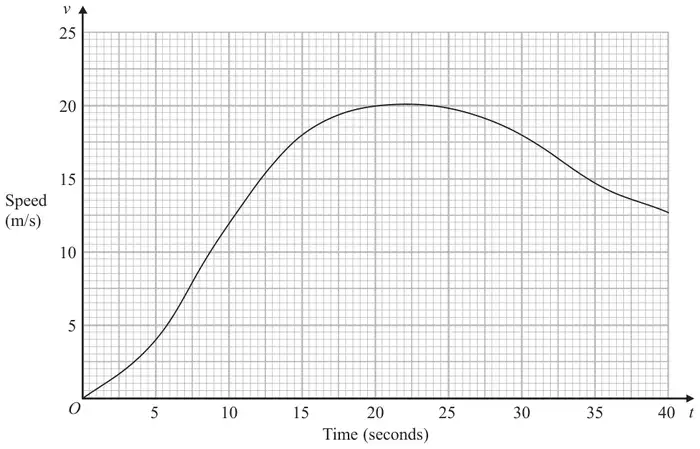
The graph gives information about the speed, \(v\) metres per second, of the car \(t\) seconds after it starts to move.
(a)
(i) Calculate an estimate of the gradient of the graph at \(t = 15\) (3)
(ii) Describe what your answer to part (i) represents. (1)
(b) Work out an estimate for the distance the car travels in the first 20 seconds of its journey.
Use 4 strips of equal width. (3)
Use 4 strips of equal width. (3)
| Answer | Mark | Mark scheme |
|---|---|---|
| 0.83 | B1 | for a tangent drawn at \(t = 15\) |
| M1 | full method to use the tangent to find the gradient (eg \(7.5 \div 9\)) | |
| A1 | for answer in the range 0.6 to 1.0 |
Additional guidance
Working: \(7.5 \div 9 = 0.83\ldots\)
No tangent scores 0 marks
This mark can be awarded if the tangent is drawn at \(t \neq 15\)
Working may be seen on the diagram
| Answer | Mark | Mark scheme |
|---|---|---|
| Statement | C1 | statement Acceptable examples acceleration rate of change of speed increase in speed over time Not acceptable examples rate of change m/s/s increase in speed |
| Answer | Mark | Mark scheme |
|---|---|---|
| 220 | P1 | for splitting the area into strips and correct process to find the area of one strip, eg \(\dfrac{5 \times 4}{2}\ (= 10)\) or \(\dfrac{(4 + 12)}{2} \times 5\ (= 40)\) or \(\dfrac{(12 + 18)}{2} \times 5\ (= 75)\) or \(\dfrac{(18 + 20)}{2} \times 5\ (= 95)\) |
| P1 | for a complete process using at least 4 strips to find the area under the curve eg, \(\text{``}10\text{''} + \text{``}40\text{''} + \text{``}75\text{''} + \text{``}95\text{''}\) | |
| A1 | for answer in the range 215 to 225 from correct working using at least 4 strips |
Additional guidance
Working
4, 12, 18, 20
Allow one error in the reading of speeds