
Higher November 2019 Paper 3 Q19
19 The graph shows information about part of a cyclist’s journey.
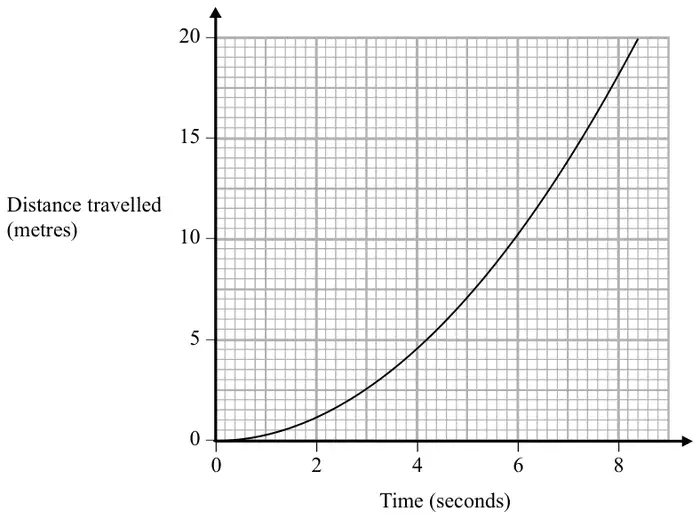
Work out an estimate of the speed, in m/s, of the cyclist at time 6 seconds. (3)
| Answer | Mark | Mark scheme |
|---|---|---|
| 3.4 | M1 | for drawing a suitable tangent at \(t = 6\) |
| M1 | for a full method to find the gradient of the tangent at \(t = 6\), eg \(20 \div 5.8\) | |
| A1 | answer in the range 3.05 to 3.7 |
Additional guidance
Use of change in y over change in x
Answers of \(\dfrac{10}{6}\) oe scores no marks