
Higher November 2019 Paper 2 Q21
21 Here is a speed-time graph for a train journey between two stations.
The journey took 100 seconds.
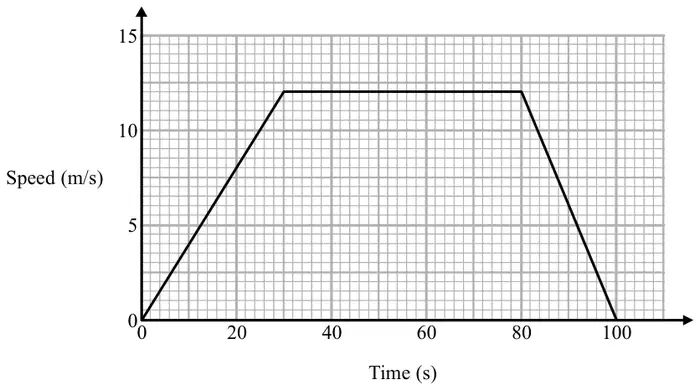
(a) Calculate the time taken by the train to travel half the distance between the two stations.
You must show all your working. (4)
You must show all your working. (4)
(b) Compare the acceleration of the train during the first part of its journey with the acceleration of the train during the last part of its journey. (1)
| Answer | Mark | Mark scheme |
|---|---|---|
| 52.5 | P1 | starts to find area under graph, eg \(\dfrac{30 \times 12}{2}\ (= 180)\) or \(50 \times 12\ (= 600)\) or \(\dfrac{20 \times 12}{2}\ (= 120)\) |
| P1 | complete process to find area under graph, eg \(\dfrac{30 \times 12}{2} + 50 \times 12 + \dfrac{20 \times 12}{2}\ (= 900)\) | |
| P1 | starts process to find half way time, eg \(((\text{``}900\text{''} \div 2) - 180) \div 12\ (= 22.5)\) | |
| A1 | 52.5 oe |
| Answer | Mark | Mark scheme |
|---|---|---|
| Comparison | C1 | acceptable comparison Acceptable (acceleration) during first part is positive but (acceleration) during last part is negative / deceleration (acceleration is) greater during the last part than during the first part gradient is steeper in the last part / longer to speed up than slow down speed / (acceleration) is increasing at start and decreasing at end (acceleration) is slower in the first part (acceleration) is ascending in the first part and descending in the last part 0.4 is the first part and \(-0.6\) in the last part Not acceptable goes down in the last part speed is greater in last part than first part |