
Higher June 2018 Paper 3 Q12
12 The graph shows the volume of liquid (\(L\) litres) in a container at time \(t\) seconds.
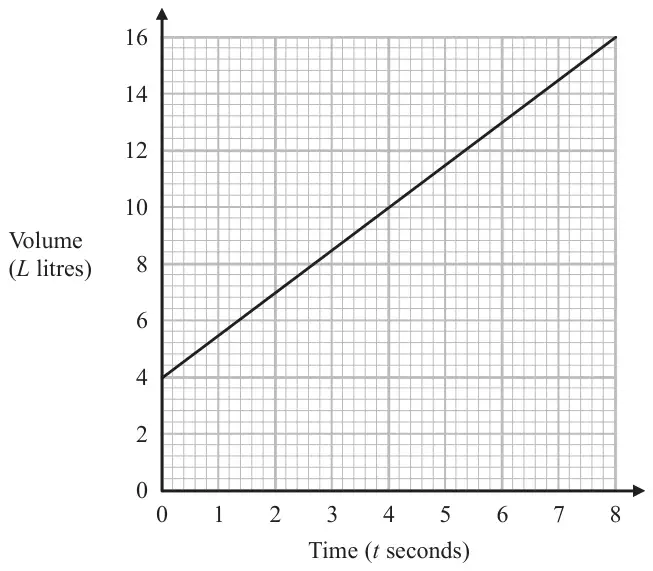
(a) Find the gradient of the graph. (2)
(b) Explain what this gradient represents. (1)
The graph intersects the volume axis at \(L = 4\)
(c) Explain what this intercept represents. (1)
| Answer | Mark | Mark scheme |
|---|---|---|
| 1.5 | M1 | for method to find the gradient of the line, eg \(\dfrac{12}{8}\) |
| A1 | for 1.5 oe |
Additional guidance
Must see use of scales.
| Answer | Mark | Mark scheme |
|---|---|---|
| Explanation | C1 | Explanation relating to rate of change of volume with time, eg rate at which the container fills or change in number of litres per second or number of litres added per second |
Additional guidance
Ignore any quantities given.
Award the mark for an explanation involving rate.
| Answer | Mark | Mark scheme |
|---|---|---|
| Explanation | C1 | Explanation relating to volume (amount) of liquid in the container at the start eg number of litres in the container when \(t = 0\), amount of liquid in the container to start with |