
Higher November 2018 Paper 1 Q9
9 The times that 48 trains left a station on Monday were recorded.
The cumulative frequency graph gives information about the numbers of minutes the trains were delayed, correct to the nearest minute.
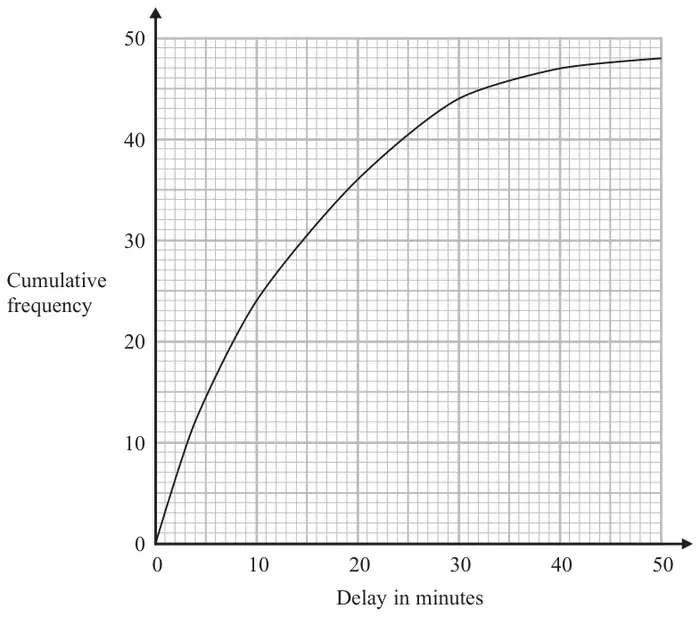
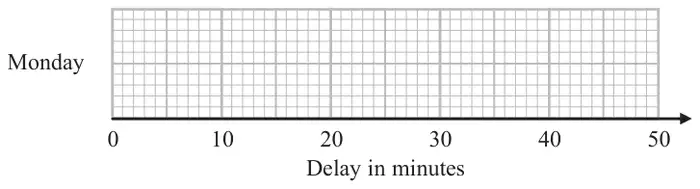
The shortest delay was 0 minutes.
The longest delay was 42 minutes.
48 trains left the station on Tuesday.
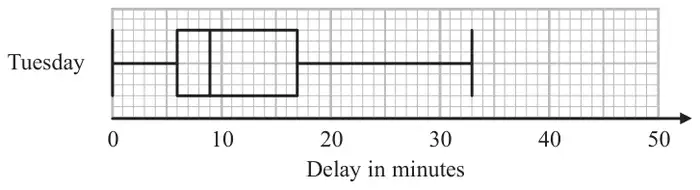
The box plot below gives information about the delays on Tuesday.
Mary says,
“The longest delay on Tuesday was 33 minutes.
This means that there must be some delays of between 25 minutes and 30 minutes.”
You must give a reason for your answer. (1)
| Answer | Mark | Mark scheme |
|---|---|---|
| box plot drawn | B1 | ends of whiskers at 0 and 42 with a box |
| B1 | median at 10 inside a box | |
| B1 | for ends of box at 4 and 20 |
Additional guidance
The box can be of any height. Accept ends that are marked (eg line, cross, dot) or defined by the end of the whiskers if clear.
Has to be inside a box; whiskers not required
An independent mark that can be awarded for just a box; do not need whiskers for this mark.
| Answer | Mark | Mark scheme |
|---|---|---|
| Comparison | C1 | for a correct comparison of medians, eg. the median delay time on Mon was greater than the median delay time on Tues. or ft (a) |
| C1 | for a correct comparison of a measure of spread, eg. the interquartile range (range) of delay times on Mon was greater than the interquartile range (range) of delay times on Tues. or ft (a) For the award of both marks at least one of the comparisons must be in context |
Additional guidance
Simply quoting values for median, range and IQR is insufficient, they must be compared
Comparisons can relate to the median, and then either the range or the IQR.
| Answer | Mark | Mark scheme |
|---|---|---|
| statement | C1 | ‘No’ with statement explaining that there might not be any delays between 25 minutes and 30 minutes as in the upper 25% (12 trains) the delays may all be between 17 and 25 or 30 and 33 |
Additional guidance
The ‘No’ may be implied from their wording, and could be written next to the “?”
The statement must mention (or imply) values above the UQ of 17