
Higher June 2017 Paper 3 Q9
9 The box plot shows information about the distribution of the amounts of money spent by some male students on their holidays.
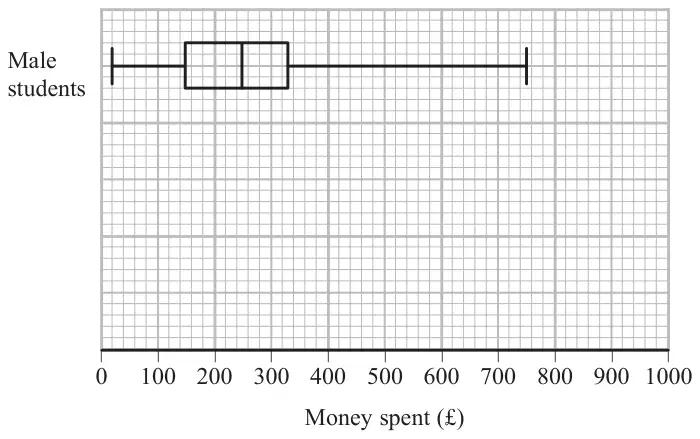
(a) Work out the interquartile range for the amounts of money spent by these male students. (2)
The table below shows information about the distribution of the amounts of money spent by some female students on their holidays.
| Smallest | Lower quartile | Median | Upper quartile | Largest | |
|---|---|---|---|---|---|
| Money spent (£) | 60 | 180 | 300 | 350 | 650 |
(b) On the grid above, draw a box plot for the information in the table. (2)
Chris says,
“The box plots show that the female students spent more money than the male students.”
(c) Is Chris correct?
Give a reason for your answer. (1)
Give a reason for your answer. (1)
| Answer | Mark | Notes |
|---|---|---|
| 180 | M1 | for evidence of using the LQ (150) and UQ (330) eg \(330 - 150\) |
| A1 | cao |
| Working | Answer | Mark | Notes |
|---|---|---|---|
| 60, 180, 300, 350, 650 | B2 | for fully correct box plot | |
| (B1) | for showing a box and at least 3 correctly plotted values |
| Working | Answer | Mark | Notes |
|---|---|---|---|
| Medians 250 and 300 | Statement | C1 | for a correct comparative statement relevant to the question e.g. Yes because the female students have a greater median than the male students |