
Higher November 2017 Paper 3 Q18
18 Here is a speed-time graph for a train.
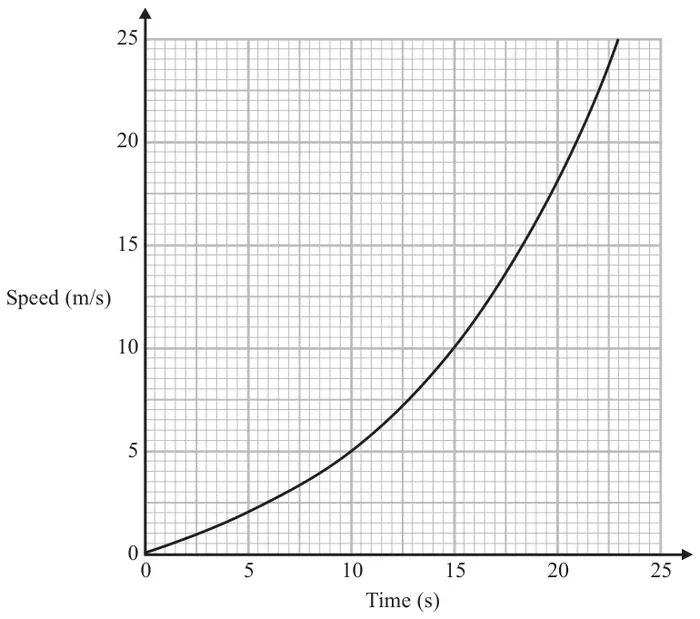
(a) Work out an estimate for the distance the train travelled in the first 20 seconds.
Use 4 strips of equal width. (3)
Use 4 strips of equal width. (3)
(b) Is your answer to (a) an underestimate or an overestimate of the actual distance the train travelled?
Give a reason for your answer. (1)
Give a reason for your answer. (1)
| Working | Answer | Mark | Notes |
|---|---|---|---|
| values 0, 2, 5, 10, 18 | 130 | M1 | for starting to find area under the curve, eg \(0.5 \times 5 \times 2\ (= 5)\) |
| M1 | for a complete method to find the area under the curve using 4 strips of equal width, eg \(\text{``}5\text{''} + 0.5 \times 5 \times (2 + 5)\ (= 17.5) + 0.5 \times 5 \times (5 + 10)\ (= 37.5) + 0.5 \times 5 \times (10 + 18)\ (= 70)\) | ||
| A1 | for 130 or answer in range 130.1 to 132 supported by accurate working |
| Answer | Mark | Notes |
|---|---|---|
| overestimate with reason | C1 | for “overestimate” and appropriate reason linked to method eg area between trapeziums and curve also included |