
Higher June 2024 Paper 2 Q14
14 The graph shows the velocity of a car, in metres per second, \(t\) seconds after it starts to slow down.
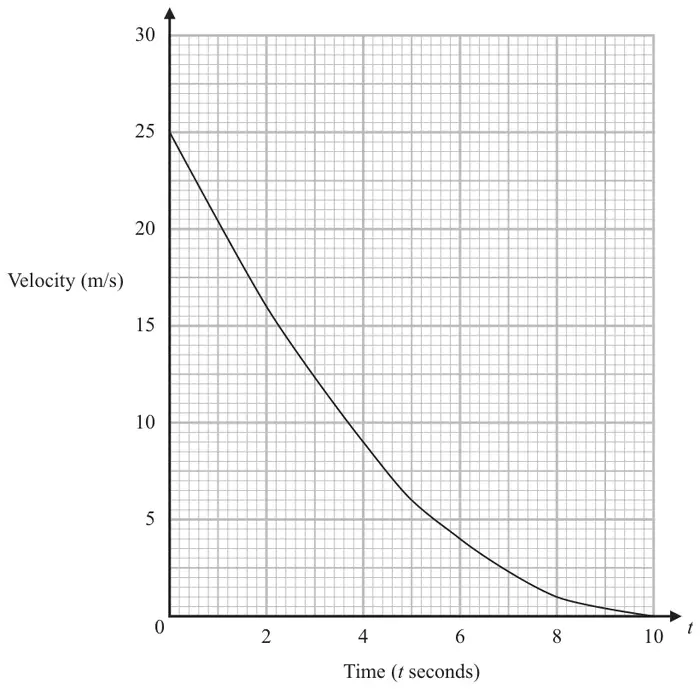
(a) Calculate an estimate for the acceleration of the car when \(t = 5\)
You must show all your working. (3)
You must show all your working. (3)
(b) Work out an estimate for the distance the car travels in the first 6 seconds after it starts to slow down.
Use 3 strips of equal width. (3)
Use 3 strips of equal width. (3)
| Answer | Mark | Mark scheme |
|---|---|---|
| \(-2.5\) | M1 | for drawing a tangent at \(t = 5\) |
| M1 | (dep on M1) for a complete method to find the gradient eg tangent at \(t = 5\) and \(\text{``}10\text{''} \div \text{``}4\text{''}\) or an answer in the range 2.0 to 2.8 | |
| A1 | for answer in the range \(-2.0\) to \(-2.8\) dependent on tangent drawn |
Additional guidance
No tangent drawn score 0 marks
Working may be seen on the diagram
Accept answers in the form \(\dfrac{a}{b}\) where \(a\) and \(b\) are integers
| Answer | Mark | Mark scheme |
|---|---|---|
| 79 | M1 | for a method to find an estimate for the area of at least 1 trapezium under the curve, eg \(\dfrac{1}{2} \times 2 \times (25 + 16)\ (= 41)\) oe or \(\dfrac{1}{2} \times 2 \times (16 + 9)\ (= 25)\) oe or \(\dfrac{1}{2} \times 2 \times (9 + 4)\ (= 13)\) oe or for a method to find an estimate for the area of at least 1 rectangle with heights at intersection of midpoint and curve, eg \(2 \times 20.5\ (= 41)\) oe or \(2 \times 12.5\ (= 25)\) oe or \(2 \times 6\ (= 12)\) oe |
| M1 | for a complete method, eg \(\dfrac{1}{2} \times 2 \times (25 + 16) + \dfrac{1}{2} \times 2 \times (16 + 9) + \dfrac{1}{2} \times 2 \times (9 + 4)\) oe or \(\dfrac{1}{2} \times 2 \times (25 + 4 + 2(16 + 9))\) or \((2 \times 20.5) + (2 \times 12.5) + (2 \times 6)\) | |
| A1 | For 79 or 78 |
Additional guidance
May be seen as a rectangle added to a triangle
Allow consistent use of incorrect width for both M marks
Allow 1 error in \(y\) values used
Allow 78 only if it comes from rectangle/midpoint method