
Higher November 2022 Paper 2 Q21
21 The graph below gives the volume, in litres, of water in a container \(t\) seconds after the water starts to fill the container.
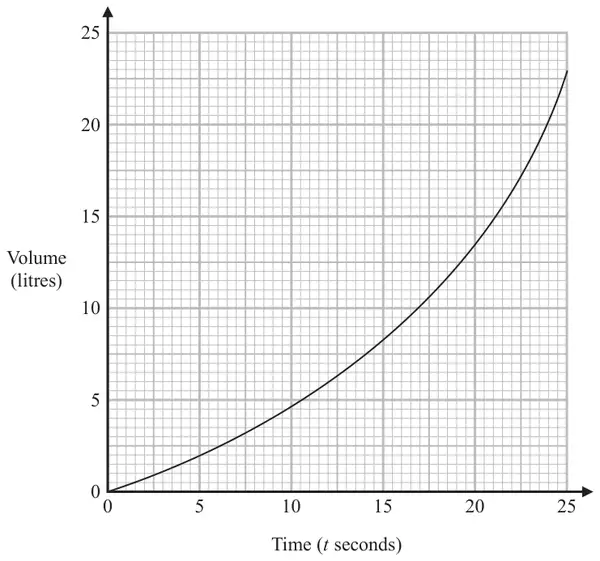
(a) Calculate an estimate for the gradient of the graph when \(t = 17.5\)
You must show how you get your answer. (3)
You must show how you get your answer. (3)
(b) Describe fully what the gradient in part (a) represents. (1)
| Answer | Mark | Mark scheme |
|---|---|---|
| 1.06 | M1 | for tangent drawn at \(t = 17.5\) |
| M1 | for a complete method to find the gradient eg tangent drawn at \(t = 17.5\), and \(18.5 \div 17.5\) | |
| A1 | answer in the range 0.9 to 1.2 |
Additional guidance
No tangent drawn at \(t=17.5\) scores zero marks
Use of change in \(y\) over change in \(x\). Working may be seen on the diagram
Answer of \(\dfrac{10.5}{17.5}\) oe scores no marks.
Accept answers in the form \(\dfrac{a}{b}\) where \(a\) and \(b\) are integers
| Answer | Mark | Mark scheme |
|---|---|---|
| Explanation | C1 | suitable explanation, eg the rate of change of volume |
Additional guidance
If units are given they must be correct