
Higher November 2018 Paper 3 Q12
12 Lewis wants to draw the graph \(\quad y = x^3 \quad\) for values of \(x\) from \(-2\) to 2
Here is his graph.
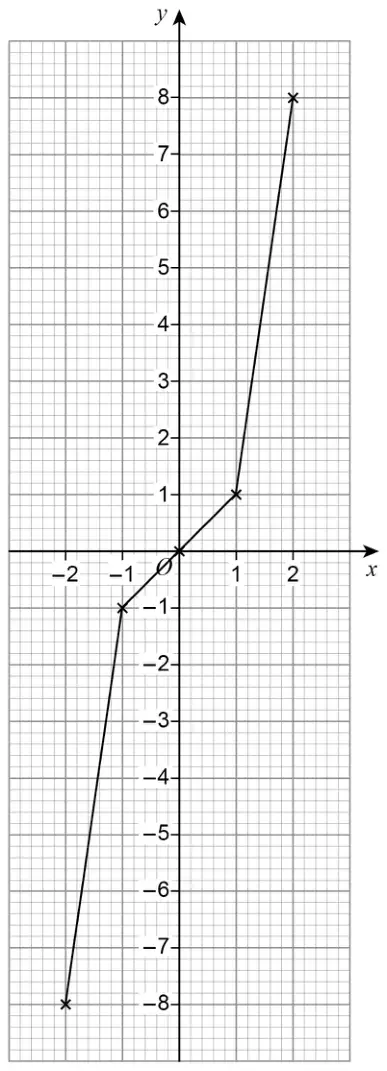
Make one criticism of his graph. [1 mark]
| Answer | Mark | Comments |
|---|---|---|
| Graph should be a curve | B1 | oe eg Should not be straight lines Not a curve Not smooth Too straight Need more points plotted |