
Higher November 2018 Paper 1 Q15
15 In a survey, queuing times at supermarket checkouts were recorded.
One morning, samples of 50 customers were taken at supermarkets A, B, C and D.
The box plots represent the results.
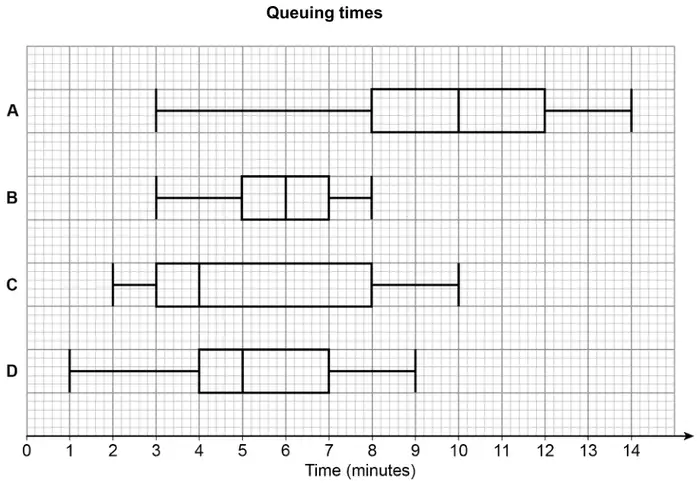
Give a reason for your answer. [2 marks]
Give a reason for your answer. [2 marks]
| Answer | Mark | Comments |
|---|---|---|
| C and ‘lowest median’ | B2 | oe B1 C |
Additional guidance
If the value of the median is given it must be 4 for B2
Accept midpoint oe for median
Do not accept mean for median
Only accept average for median if the value of 4 is also given
Accept mention of the lowest lower quartile with correct mention of the median for B2, but do not accept mention of any extra statistical measure as part of their justification
| Answer | Mark | Comments |
|---|---|---|
| B and ‘lowest interquartile range’ or B and ‘lowest range’ | B2 | oe B1 B |
Additional guidance
If the value of the interquartile range is given it must be 2 for B2
If the value of the range is given it must be 5 for B2
For B2, do not accept non-statistical reasons, eg ‘the narrowest box’
For B2, do not accept mention of any extra statistical measure as part of their justification