
Higher June 2019 Paper 3 Q19
19 Here is some information about the times people took to complete a survey.
| Fastest time Slowest time Median Lower quartile Interquartile range | 3 minutes 18 minutes 11 minutes 7 minutes 8 minutes |
Ben draws this box plot to show the information.
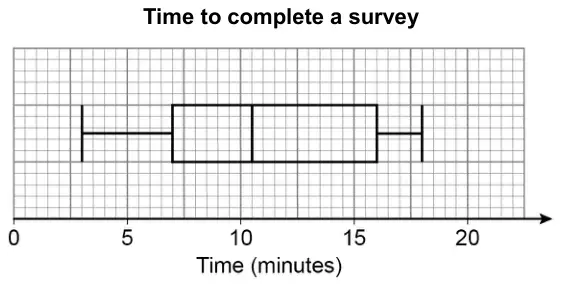
Make two criticisms of his box plot. [2 marks]
| Answer | Mark | Comments |
|---|---|---|
| Median is at 10.5 | B1 | oe eg median should be one square to the right |
| Upper quartile should be at 15 | B1 | oe eg IQR is 9 eg UQ should be two squares to the left |
Additional guidance
| Ignore irrelevant and non-contradictory statements alongside a B1 response | |
| To score either mark, answers must correctly refer to a number of minutes or exact position on the box plot | |
| The median should be at 11 | B1 |
| The median is half a minute too low | B1 |
| The interquartile range should be 8 | B1 |
| The interquartile range is one minute too big | B1 |
| Upper quartile = 16 minutes | B1 |
| The median is in the wrong place | B0 |
| The median is 11 | B0 |
| The median is wrong | B0 |
| The median is inaccurate by 1 square | B0 |
| The interquartile range is too small | B0 |
| The upper quartile should be at 16 | B0 |
| The upper quartile is wrong by 1 | B0 |