
Higher November 2020 Paper 2 Q28
28 A horse runs in a field.
The speed-time graph represents the first 12 seconds of the run.
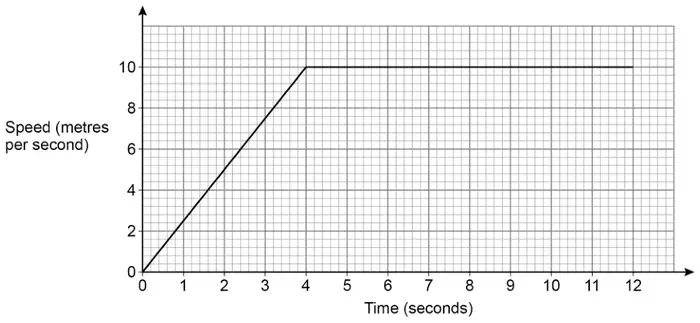
After how many seconds had the horse run a distance of 75 metres? [3 marks]
| Answer | Mark | Comments |
|---|---|---|
| Alternative method 1 | ||
| \(0.5 \times 4 \times 10\) or 20 | M1 | oe may be seen on graph |
| \(\dfrac{75 - 0.5 \times 4 \times 10}{10}\) or \(\dfrac{55}{10}\) or 5.5 | M1dep | oe may be embedded eg \(5.5 \times 10 = 55\) |
| 9.5 | A1 | oe |
| Alternative method 2 | ||
| Correct method or value for distance travelled in the first \(t\) seconds where \(t > 4\) | M1 | eg distance for 12s = 100 or distance for 9s \(= 0.5 \times (9 + 5) \times 10\) or 70 may be seen on graph |
| \(\dfrac{\text{their distance} - 75}{10}\) or \(\dfrac{75 - \text{their distance}}{10}\) | M1dep | eg \(\dfrac{100 - 75}{10}\) or \(\dfrac{75 - 70}{10}\) |
| 9.5 | A1 | oe |
Additional guidance
1st M can be awarded even if not subsequently used