
Higher June 2018 Paper 3 Q26
26 The histogram shows information about the speed of cars as they pass a checkpoint.
The scale on the frequency density axis is missing.
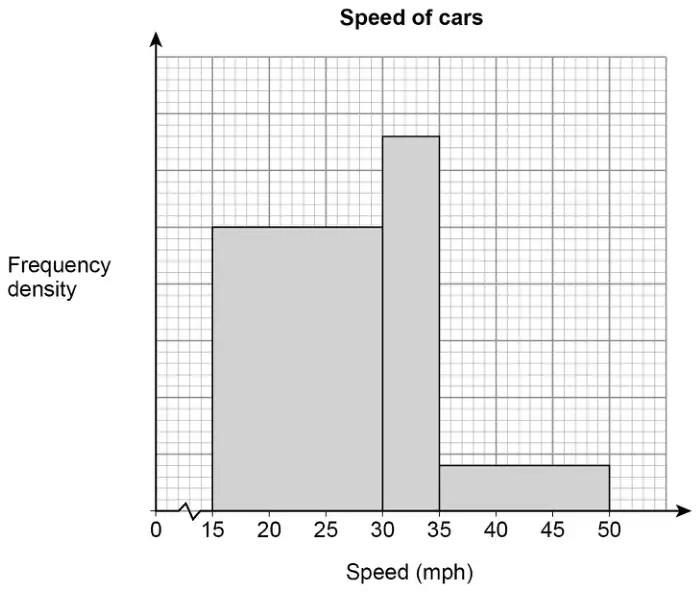
The histogram shows information about 480 cars.
(a) How many cars does the first bar represent? [4 marks]
(b) Cars with a speed greater than 40 mph are over the speed limit.
Use the histogram to estimate the number of cars that are over the speed limit. [2 marks]
| Answer | Mark | Comments |
|---|---|---|
| Alternative method 1 – Counting squares | ||
| 15 or 6.6 or 2.4 (cm squares) | M1 | 375 or 165 or 60 (small squares) |
| their 15 + their 6.6 + their 2.4 or 24 (total cm squares) | M1dep | allow one error their 375 + their 165 + their 60 or 600 (total small squares) |
| \(\dfrac{\text{their } 15}{\text{their } 24}\) or \(\dfrac{\text{their } 375}{\text{their } 600}\) or 0.625 or \(\dfrac{480}{\text{their } 600}\) or 0.8 (cars per small square) or \(\dfrac{480}{\text{their } 24}\) or 20 (cars per cm square) | M1dep | oe \(\dfrac{\text{their } 600}{480}\) or 1.25 (small squares per car) \(\dfrac{\text{their } 24}{480}\) or 0.05 (cm square per car) |
| 300 | A1 | |
| Alternative method 2 – Using f.d. scale of \(x\) per unit | ||
| \(5x \times 15\) or \(75x\) or \(6.6x \times 5\) or \(33x\) or \(0.8x \times 15\) or \(12x\) (\(x\) per cm) | M1 | \(25x \times 15\) or \(375x\) or \(33x \times 5\) or \(165x\) or \(4x \times 15\) or \(60x\) (\(x\) per small square) |
| \(5x \times 15 + 6.6x \times 5 + 0.8x \times 15\) or \(75x + 33x + 12x\) or \(120x\) (\(x\) per cm) | M1dep | allow one error \(25x \times 15 + 33x \times 5 + 4x \times 15\) or \(375x + 165x + 60x\) or \(600x\) (\(x\) per small square) |
| their \(120x = 480\) or \(x = 4\) | M1dep | oe \(\dfrac{480}{\text{their } 120}\) or 4 |
| 300 | A1 | |
| Alternative method 3 – Using a number scale of f.d. axis | ||
| \(5 \times 15\) or 75 or \(6.6 \times 5\) or 33 or \(0.8 \times 15\) or 12 | M1 | \(25 \times 15\) or 375 or \(33 \times 5\) or 165 or \(4 \times 15\) or 60 |
| \(5 \times 15 + 6.6 \times 5 + 0.8 \times 15\) or \(75 + 33 + 12\) or 120 (1 per cm) | M1dep | allow one error \(25 \times 15 + 33 \times 5 + 4 \times 15\) or \(375 + 165 + 60\) or 600 (1 per small square) |
| \(\dfrac{\text{their } 15}{\text{their } 24}\) or \(\dfrac{\text{their } 375}{\text{their } 600}\) or 0.625 or \(\dfrac{480}{\text{their } 600}\) or 0.8 (cars per small square) or \(\dfrac{480}{\text{their } 24}\) or 20 (cars per cm square) | M1dep | oe \(\dfrac{\text{their } 600}{480}\) or 1.25 (small squares per car) \(\dfrac{\text{their } 24}{480}\) or 0.05 (cm square per car) |
| 300 | A1 | |
Additional guidance
| Check diagram for working | |
| Alternative method 1 Total squares must be the sum of three numbers | |
| Alternative method 2 Must be the sum of three expressions | |
| The correct f.d. labels for the heights of the bars are 20, 26.4 and 3.2 | |
| A correct frequency density scale using 1 cm = 4 units eg | |
| 4 seen on vertical scale at 1 cm | M1M1M1 |
| 20 seen on vertical scale at 5 cm | M1M1M1 |
| Answer | Mark | Comments |
|---|---|---|
| \(\dfrac{2}{3} \times 2.4\) or 1.6 or \(\dfrac{2}{3} \times 60\) or 40 or \(\dfrac{2}{3} \times 48\) or \(10 \times 0.8 \times 4\) | M1 | oe |
| 32 | A1 |