
Higher June 2018 Paper 3 Q24
24 The speed-time graph shows 20 seconds of a car journey.
Harry wants to estimate the distance the car travels in this time.
He uses a triangle and a trapezium, as shown, to estimate the area under the graph.
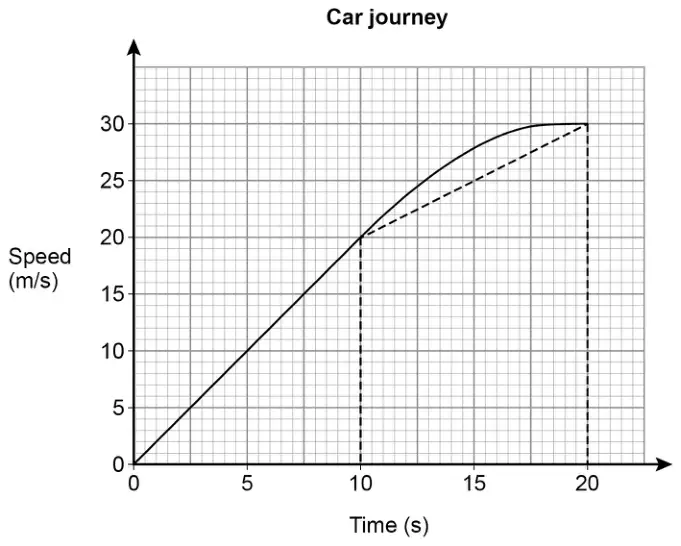
(a) Complete Harry’s method to estimate the distance the car travels. [3 marks]
(b) For this journey, which of these is true for Harry’s method?
Tick one box. [1 mark]
- It works out an overestimate of the distance
- It works out an underestimate of the distance
- It could work out an overestimate or an underestimate of the distance
| Answer | Mark | Comments |
|---|---|---|
| Alternative method 1 | ||
| \(\dfrac{1}{2} \times 10 \times 20\) or 100 | M1 | oe Area of triangle on left |
| \(\dfrac{1}{2} \times (20 + 30) \times 10\) or 250 or \(20 \times 10\) or 200 and \(\dfrac{1}{2} \times 10 \times 10\) or 50 | M1 | oe Area of trapezium on right |
| 350 | A1 | |
| Alternative method 2 | ||
| \(\dfrac{1}{2} \times 10 \times 10\) or 50 | M1 | oe Area of triangle on top right |
| \(\dfrac{1}{2} \times (20 + 10) \times 20\) or 300 or \(10 \times 20\) or 200 and \(\dfrac{1}{2} \times 10 \times 20\) or 100 | M1 | oe Area of trapezium across bottom |
| 350 | A1 | |
Additional guidance
| \(\dfrac{1}{2} \times (0 + 2 \times 20 + 30) \times 10\) (using Trapezium rule) | M1M1 |
| Beware of 300 from incorrect working | |
| Beware \((30 - 20) \times (20 - 10) = 100\) is incorrect working |
| Answer | Mark | Comments |
|---|---|---|
| It works out an underestimate of the distance | B1 |