
Foundation June 2018 Paper 2 Q18
18 A shop sells raincoats and umbrellas.
The scatter graph shows the monthly sales for 12 months.
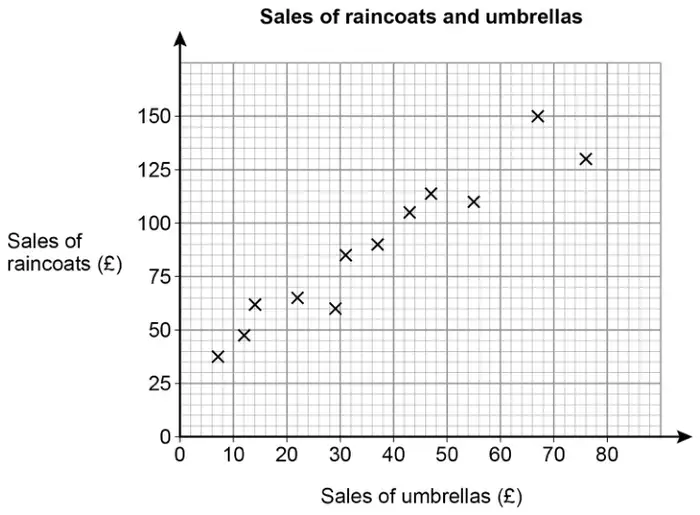
(a) Write down the type of correlation shown by the graph. [1 mark]
(b) The manager expects the sales of umbrellas next month to be £60
Draw a line of best fit to estimate the sales of raincoats next month. [3 marks]
| Answer | Mark | Comments |
|---|---|---|
| Positive | B1 |
Additional guidance
Ignore descriptive words such as ‘strong’ or ‘weak’ or ‘scattered’
| Answer | Mark | Comments |
|---|---|---|
| Correct straight line which passes between (10, 35) and (10, 55) and between (70, 135) and (70, 155) | B1 | line must extend from 10 to 70 |
| Draws a vertical line from umbrella sales of £60 to meet their line or marks a point on their line of best fit corresponding to umbrella sales of £60 | M1 | their line / curve must be increasing may be implied by correct value for their line / curve |
| Correct value for their line | A1ft | ft their increasing line / curve allow any reading within one vertical square eg if their vertical line crosses their line of best fit in the first square above 125, allow [125, 130] |
Additional guidance
| No increasing line / curve drawn | B0M0A0 |
| Mark intention for straight line for B1 | |
| The line may go through the coordinates of the gates but must not go above or below | |
| Ignore any parts of the line outside the range 10 to 70 |