
Higher June 2022 Paper 1 Q27
27 The grid shows the graph of \(\quad y = \mathrm{f}(x)\)
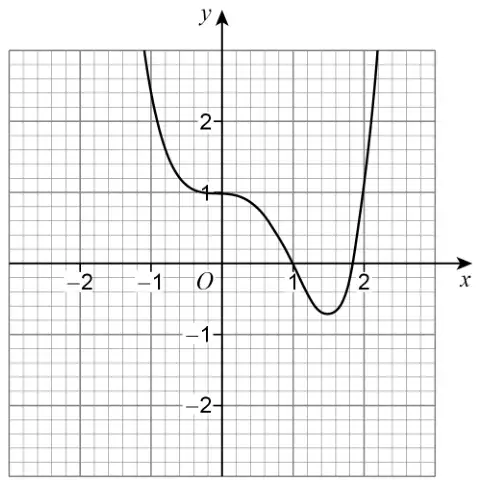
On the grid, draw the graph of \(\quad y = -\mathrm{f}(x)\) [2 marks]
| Answer | Mark | Comments |
|---|---|---|
| Reflection of given graph in the \(x\)-axis | M1 | mark intention |
| Correct shape of graph from ([\(-1.5\), \(-1\)], \(-3\)) through (0, \(-1\)) through (1, 0) maximum at ([1.4, 1.6], [0.6, 0.8]) through (1.8, 0) to ([2, 2.5], \(-3\)) | A1 |
Additional guidance
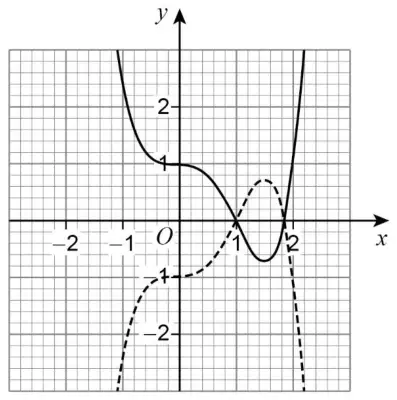 | M1A1 |
| Feathering or double lines or a split line, but intention to reflect in the \(x\)-axis | M1A0 |