
Foundation November 2020 Paper 1 Q12
12 The Venn diagram shows information about 50 people who are in bands.
\(S\) = singers \(G\) = guitar players
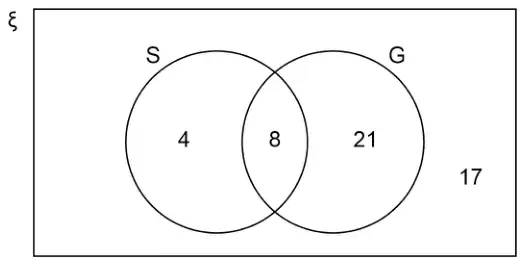
(a) How many of the people are guitar players? [1 mark]
(b) How many of the people are singers but not guitar players? [1 mark]
(c) One of the people is chosen at random.
Write down the probability that the person is
not a singer
and
not a guitar player. [1 mark]
| Answer | Mark | Comments |
|---|---|---|
| 29 | B1 |
Additional guidance
Accept 29 out of 50
Do not accept \(\dfrac{29}{50}\) or 29 : 50
| Answer | Mark | Comments |
|---|---|---|
| 4 | B1 |
Additional guidance
Accept 4 out of 50
Do not accept \(\dfrac{4}{50}\) or 4 : 50
| Answer | Mark | Comments |
|---|---|---|
| \(\dfrac{17}{50}\) or 0.34 or 34% | B1 | oe fraction |
Additional guidance
| Ignore attempts to simplify or convert a correct fraction | |
| Ignore probability words | |
| 17 out of 50 or 17 in 50 or 17 : 50 is B0 however, condone 17 out of 50 or 17 in 50 with a correct fraction, decimal or percentage (together on answer line) but do not accept 17 : 50 with a correct fraction, decimal or percentage (together on answer line) | B1 B0 |