
Higher November 2022 Paper 3 Q13
13 A fair, ordinary dice is rolled and a counter is taken at random from a bag.
The tree diagram shows the probabilities.
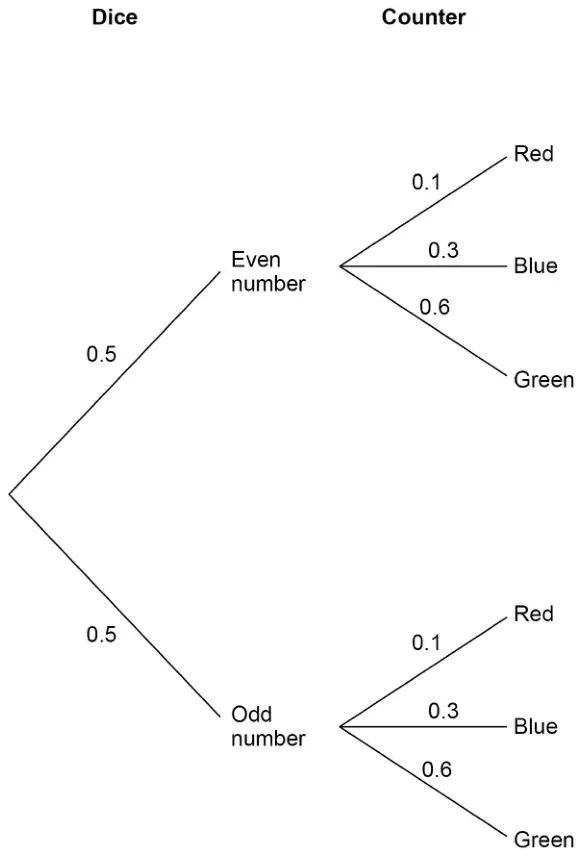
(a) How do the probabilities show that all the counters in the bag are red, blue or green? [1 mark]
(b) Circle the probability that the counter is red or blue. [1 mark]
- 0.0009
- 0.8
- 0.03
- 0.4
(c) Circle the probability that the dice lands on an even number and the counter is blue. [1 mark]
- 0.15
- 0.3
- 0.35
- 0.8
| Answer | Mark | Comments |
|---|---|---|
| The probabilities sum to 1 | B1 | oe eg \(0.1 + 0.3 + 0.6 = 1\) |
Additional guidance
| Ignore comments about the dice, eg \(0.5 + 0.5 = 1\) | |
| Do not accept an incorrect statement alongside a correct one eg they add up to 1 and \(0.1 + 0.4 + 0.6 = 1\) | B0 |
| All probabilities add up to 100% | B1 |
| It doesn’t include any other colours | B0 |
| They add to a whole number | B0 |
| The probabilities are not zero | B0 |
| The only colours on the tree diagram are red, blue and green | B0 |
| Answer | Mark | Comments |
|---|---|---|
| 0.4 | B1 |
| Answer | Mark | Comments |
|---|---|---|
| 0.15 | B1 |