
Foundation June 2019 Paper 2 Q16
16 The graph below is used to convert between
temperature in degrees Fahrenheit (\(F\))
and
temperature in degrees Celsius (\(C\)).
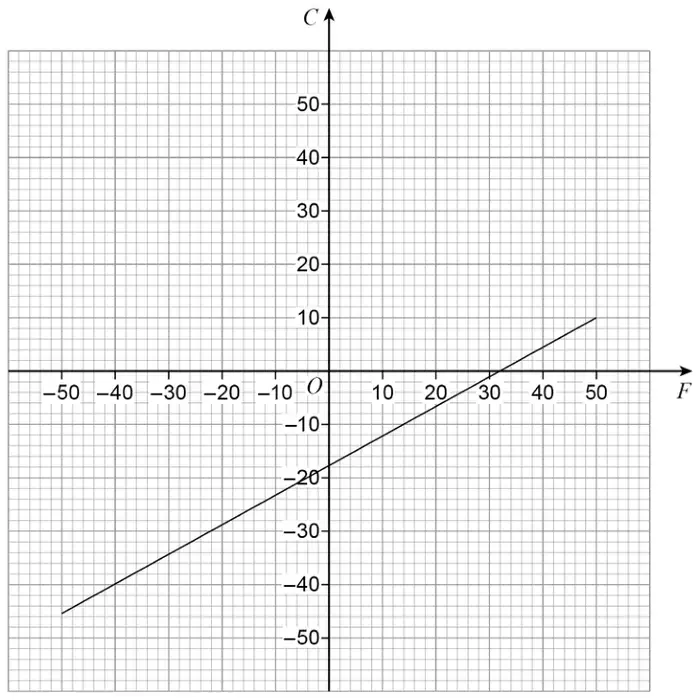
(a) Use the graph to convert 40 degrees Fahrenheit into degrees Celsius. [1 mark]
At one temperature, \(T\),
the number of degrees Celsius is double the number of degrees Fahrenheit.
The graph of \(\quad C = 2F \quad\) can be drawn to help find this temperature.
(b) On the grid above, draw the graph of \(\quad C = 2F \quad\) for values of \(F\) from \(-25\) to 25
You may use the table to help you. [2 marks]
| \(F\) | \(-25\) | ||
| \(C\) | \(-50\) |
(c) Use your graph to estimate the value of \(T\).
Give your answer in degrees Celsius. [2 marks]
Give your answer in degrees Celsius. [2 marks]
| Answer | Mark | Comments |
|---|---|---|
| [4, 5] | B1 |
| Answer | Mark | Comments |
|---|---|---|
| Correct ruled straight line from \((-25, -50)\) to \((25, 50)\) | B2 | \(\pm \dfrac{1}{2}\) small square ignore ends of line outside \([-25, 25]\) B1 two correct points added to the table or at least two correct points plotted or correct line too short but crosses 2 horizontal centimetre squares |
Additional guidance
| The correct points in the table or on the graph may be outside \([-25, 25]\) eg \((100, 200)\) and \((-100, -200)\) in the table | B1 |
| For B1, do not count a point as correct if another point has the same \(x\)-coordinate, otherwise ignore extra points that are incorrect | |
| The B1 for points plotted cannot be implied by a line – you must see eg crosses or dots | |
| Ignore incorrect points in the table if B1 or B2 gained elsewhere |
| Answer | Mark | Comments |
|---|---|---|
| Correct reading of \(C\) coordinate of intersection of their graph with the given graph | B2ft | ft their intersection from any line or curve \(\pm \dfrac{1}{2}\) small square B1 line drawn horizontally from point of intersection to vertical axis or \(F\) coordinate of intersection given |
Additional guidance
| Their line does not intersect given line or they have no line | B0 |
| If their graph intersects given line at more than one point and they give all the \(C\) coordinates of the intersections | B1 |
| If their line is correct the answer should be approximately \(-25\) | |
| If their line is correct the \(F\) coordinate should be approximately \(-12\) | |
| Both their \(-25\) and their \(-12\) given eg correct line seen and \((-25, -12)\) or \((-12, -25)\) | B1 |