
Higher November 2023 Paper 1 Q15
15 A race was run in 2019 and in 2020
The box plot shows information about the finishing times in 2019
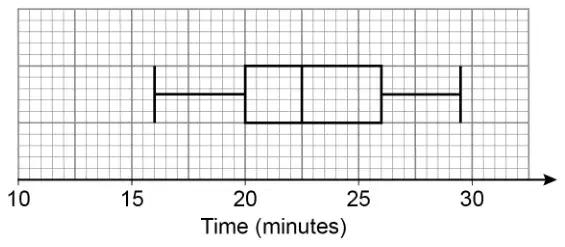
(a) In 2019, what was the fastest time? [1 mark]
(b) The table shows information about the finishing times in 2020
| Lower quartile | 21 minutes |
| Median | 24 minutes |
| Upper quartile | 27 minutes |
Use the data to comment on each of the following statements. [4 marks]
On average, times were faster in 2019 than in 2020
Times were equally consistent in 2019 and 2020
| Answer | Mark | Comments |
|---|---|---|
| 16 | B1 |
| Answer | Mark | Comments |
|---|---|---|
| Average | ||
| Indicates that the statement is correct and uses the median to support their decision | B2 | eg Yes, as median is lower (in 2019) B1 median is lower in 2019 with no or incorrect decision or median (for 2019) is 22.5 |
| Consistency | ||
| Indicates that the statement is correct and uses the IQR to support their decision or states that both quartiles were 1 minute greater in 2020 | B2 | eg IQRs are equal, so same consistency B1 IQR is the same with no or incorrect decision or IQR (for 2019) is 6 or IQR (for 2020) is 6 |
Additional guidance
| Average | |
| For B2 or B1, ignore reference to the LQ or UQ | |
| Condone 22.30 for the median | |
| For B2 or B1, if using ‘average’ for ‘median’ the value(s) must be given | |
| Incorrect value for the 2019 median can score B1 if lower than 24 eg It’s correct, the 2019 median was 23.5 | B1 |
| Reference to IQR | B1max |
| Median is 22.5, so true | B2 |
| Correct, the median is 1.5 lower in 2019 / Yes, it was 1.5 seconds faster | B2 |
| Consistency | |
| Allow calculation seen to imply IQR eg (2019) \(26 - 20 = 6\) | |
| Ignore reference to the range in 2019 | |
| Reference to median | B1max |
| \(26 - 20 = 27 - 21\) so this is true | B2 |
| 6 not accompanied by a calculation or reference to IQR | B0 |
| 6 stated to be the range | B0 |