
Foundation November 2022 Paper 1 Q13
13 The composite bar chart shows information about the number of people living in a village.
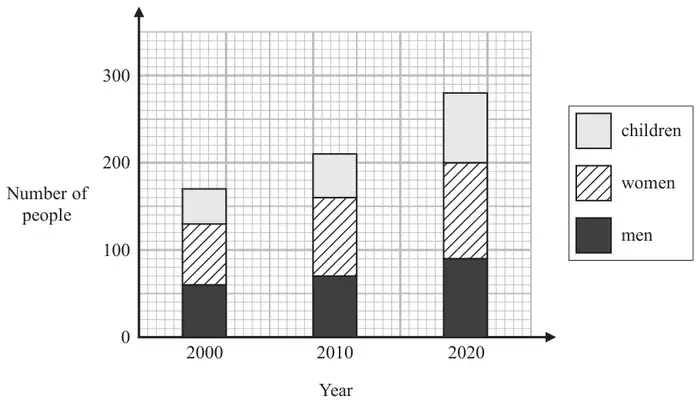
(a) Write down the number of men living in the village in the year 2000 (1)
(b) Find the number of children living in the village in the year 2010 (1)
For the people living in the village in the year 2020
(c) find the ratio of the number of children to the total number of men and women. (2)
| Answer | Mark | Mark scheme |
|---|---|---|
| 60 | B1 | cao |
Additional guidance
May be seen on diagram
| Answer | Mark | Mark scheme |
|---|---|---|
| 50 | B1 | cao |
Additional guidance
May be seen on diagram
| Answer | Mark | Mark scheme |
|---|---|---|
| 80 : 200 | P1 | for process to use the number of children, 80 or the total number of men and women, 200 in a ratio or for \(\dfrac{80}{200}\) |
| A1 | for 80 : 200 oe |
Additional guidance
Award for a correct ratio even if subsequently incorrectly simplified.