
Foundation June 2023 Paper 1 Q23
23 The table shows information about the daily rainfall in a town for 60 days.
| Rainfall (\(R\) mm) | Frequency |
|---|---|
| \(0 \leqslant R \lt 5\) | 8 |
| \(5 \leqslant R \lt 10\) | 24 |
| \(10 \leqslant R \lt 15\) | 13 |
| \(15 \leqslant R \lt 20\) | 11 |
| \(20 \leqslant R \lt 25\) | 4 |
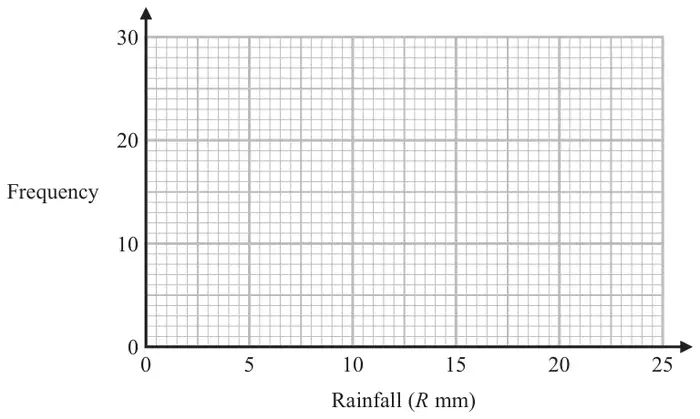
Draw a frequency polygon for this information. (2)
| Answer | Mark | Mark scheme |
|---|---|---|
| Frequency polygon drawn | B2 | for fully correct frequency polygon with points plotted at the midpoints |
| (2.5, 8), (7.5, 24) (12.5, 13) (17.5, 11) (22.5, 4) | (B1 | for all points plotted correctly but not joined with line segments or points plotted at correct heights not at midpoints but consistently within each interval and joined with line segments or correct frequency polygon with one point incorrect or correct frequency polygon with first and last points joined directly) |
Additional guidance
Joining must be with line segments
Accept points plotted within half a small square
Ignore any histogram drawn and any part of a frequency polygon outside range of first and last points plotted
for example, at 0, 5, 10,…or at 5, 10, 15,…