
Foundation November 2024 Paper 2 Q21
21 The scatter graph shows information about some ships.
It shows the length and the width of each ship.
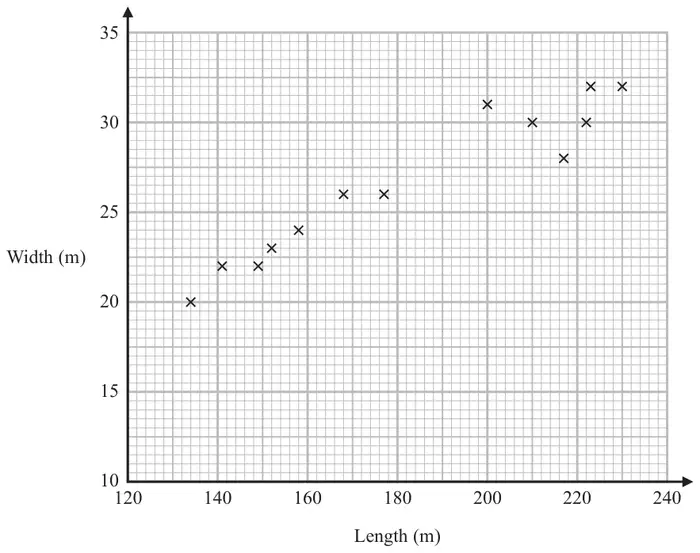
(a) What type of correlation does this scatter graph show? (1)
(b) Draw a line of best fit on the scatter graph. (1)
A different ship has a length of 194 metres.
(c) Use your line of best fit to find an estimate for the width of this ship. (1)
| Answer | Mark | Mark scheme |
|---|---|---|
| positive | C1 | cao |
Additional guidance
Ignore any description of a relationship and any reference to strength of correlation
| Answer | Mark | Mark scheme |
|---|---|---|
| lobf drawn | C1 | for straight line passing between (140, 20) and (140, 22.5) and between (220, 30) and (220, 32.5) |
| Answer | Mark | Mark scheme |
|---|---|---|
| 26.5 to 29.5 | C1 | for answer in range 26.5 – 29.5 or ft single line with positive gradient |