
Higher June 2017 Paper 2 Q10
10 The pie chart shows information about voters in an election.
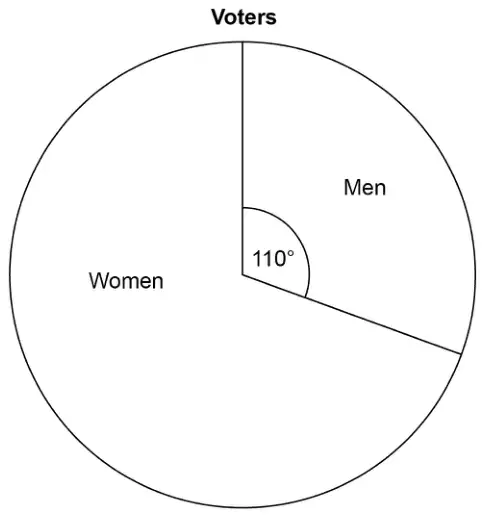
3360 more women voted than men.
Work out the total number of voters. [3 marks]
| Answer | Mark | Comments |
|---|---|---|
| Alternative method 1 | ||
| \(360 - 110\) or 250 or \(360 - 110 - 110\) or 140 | M1 | May be seen on diagram oe |
| \(3360 \div\) their 140 or 24 or 2640 (men) or 6000 (women) | M1dep | their 140 must be from \(360 - 110 - 110\) oe |
| 8640 | A1 | SC2 4838 or 4839 |
| Alternative method 2 | ||
| \(100 - \dfrac{110}{360} \times 100\) or \(100 - 30.5(\ldots)\) or \(100 - 30.6\) or 69.4(…%) or 69.5(%) or \(100 - \dfrac{110}{360} \times 100 - \dfrac{110}{360} \times 100\) or \(100 - 30.5(\ldots) - 30.5(\ldots)\) or \(100 - 30.6 - 30.6\) or 38.8(…%) or 38.9(%) | M1 | May be seen on diagram oe |
| \(3360 \div\) (their 69.4 \(-\) their 30.5) or \(3360 \div\) their 38.8(…) or 86.4 | M1dep | their 69.4 must be from \(100 - \dfrac{110}{360} \times 100\) their 30.5 must be from \(\dfrac{110}{360} \times 100\) |
| 8640 | A1 | SC2 4838 or 4839 |
| Alternative method 3 | ||
| \(\dfrac{250}{360}x - \dfrac{110}{360}x = 3360\) or \(m = \dfrac{110}{360} \times (m + 3360 + m)\) or \(w = \dfrac{250}{360} \times (w + w - 3360)\) | M1 | Sets up a correct equation to work out total \((x)\), men \((m)\) or women \((w)\) oe |
| \(x = 3360 \div \left(\dfrac{250 - 110}{360}\right)\) or \(m = 336\,000 \div 140\) or 2640 or \(w = 840\,000 \div 140\) or 6000 | M1dep | oe |
| 8640 | A1 | SC2 4838 or 4839 |
Additional guidance
| Condone 8639.9… \(\to\) answer 8640 | M2 A1 |
| 2640 or 6000 | M2 |
| 4838 and 4839 come from 3360 women | SC2 |