For the first 30 minutes her average speed is 40 miles per hour.
She then stops for 15 minutes.
She then completes the journey at an average speed of 60 miles per hour.
The total journey time is 1 hour.
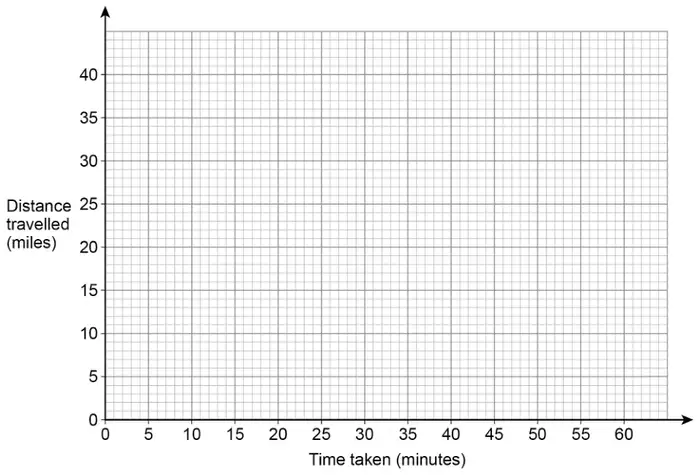
(a) Draw a distance-time graph for her journey. [3 marks]
(b) Write down the average speed for the total journey. [1 mark]
Mark scheme (a)
Answer
Mark
Comments
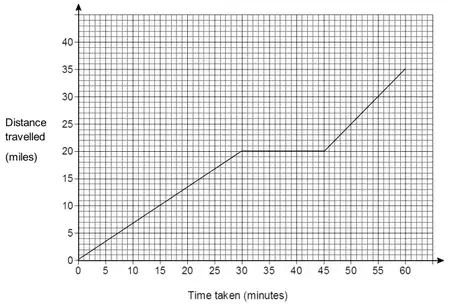
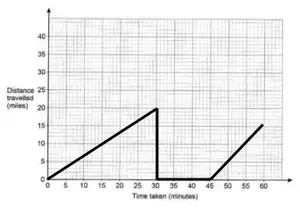
Joins (0, 0) to (30, 20)
B1
Line does not need to be straight but must start and finish at correct points and not be decreasing Mark intention
Horizontal line for 15 minutes from their (30, 20)
B1ft
Mark intention
Line with gradient 1 or a curve from their (45, 20) and stops at 60 minutes or stops at top edge of grid or higher but not beyond 60 minutes
B1ft
A curve must not be decreasing and must start and finish at two points that could be joined by a line with gradient 1 Condone a horizontal or vertical line from 60 minutes Mark intention
Additional guidance
B3
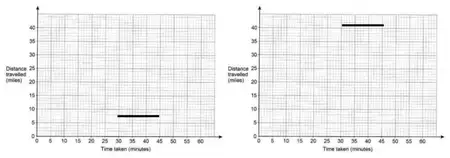
Allow any horizontal line between 30 minutes and 45 minutes if first part of journey is blank eg
B0B1
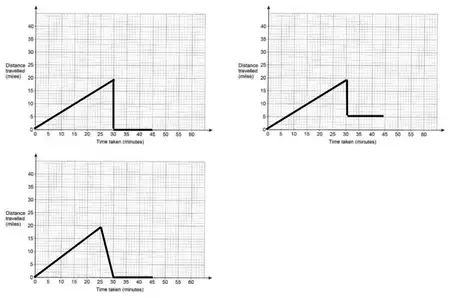
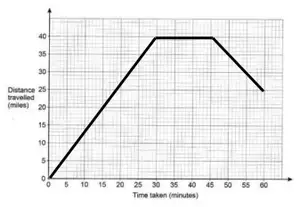
Do not allow second mark if their first line is followed by a drop back towards the horizontal axis before she stops eg
B1B0 (first two) B0B0 (third)
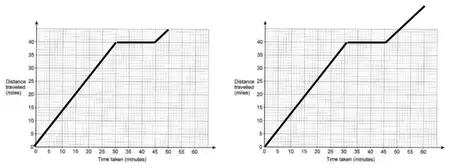
If there are more than 3 lines or curves, assume the last part is the part where she completes her journey eg
B1B0B1ft
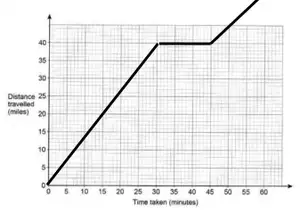
If their (45, 20) is too high to fit a line of gradient 1 ending at 60 minutes, allow the final line to stop at the top of the grid or higher, but not beyond 60 minutes eg
B0B1ftB1ft
Points but no lines
B0
Ignore any lines that could be working for part (a) or part (b)
Mark scheme (b)
Answer
Mark
Comments
35
B1ft
Correct or ft total distance travelled for their graph at 60 minutes
Additional guidance
35 from any or no graph
B1
If their graph extends beyond 60 minutes, read off at 60 minutes for ft
Follow through total distance travelled eg (a)(b) answer 25 (b) answer 55
B0ft B1ft
Ignores the stationary parts
B0
Do not follow through a graph above the grid at 60 eg (a)(b) answer 55