
Higher June 2017 Paper 1 Q23
23 Here is a velocity-time graph of a motorbike for 25 seconds.
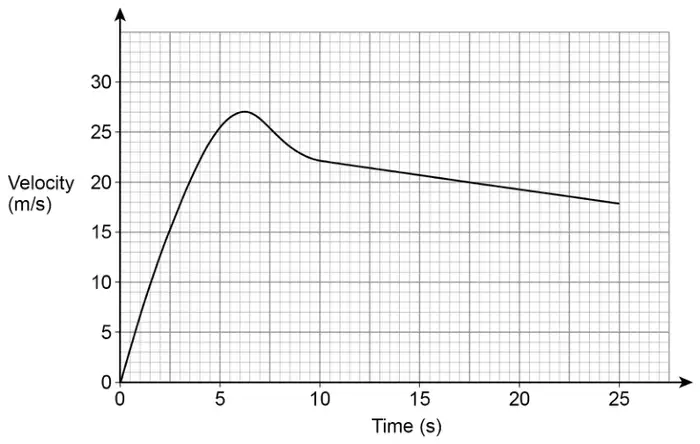
(a) After how many seconds was the acceleration zero? [1 mark]
(b) Work out the distance travelled in the last 15 seconds. [2 marks]
| Answer | Mark | Comments |
|---|---|---|
| [6, 6.5] | B1 |
| Answer | Mark | Comments |
|---|---|---|
| Alternative method 1 | ||
| \(\dfrac{1}{2} \times (22 + 18) \times (25 - 10)\) or \(15 \times 18 + \dfrac{1}{2} \times 15 \times 4\) | M1 | oe |
| 300 | A1 | |
| Alternative method 2 | ||
| \(20 \times 15\) | M1 | |
| 300 | A1 | |
Additional guidance
Alternative method 2 uses average velocity \(\times\) time