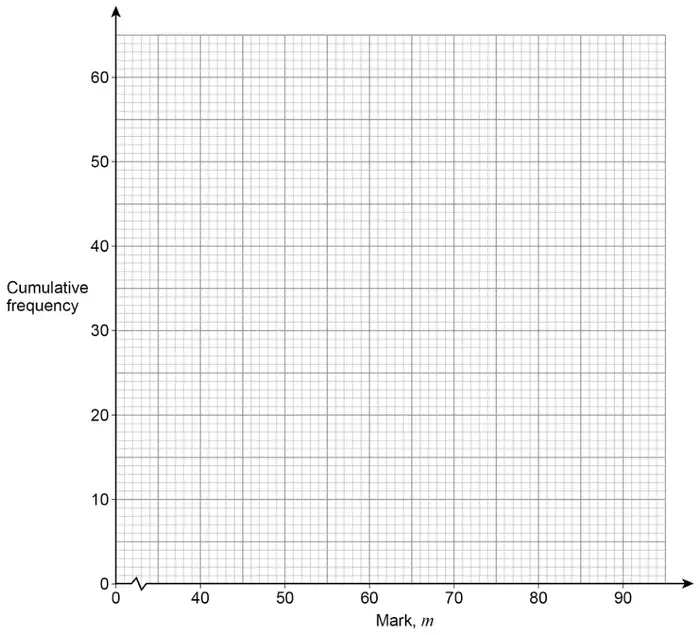
19 Here is some information about the marks of 60 students in a test.
Mark, \(m\)
Frequency
\(40 \lt m \leqslant 50\)
9
\(50 \lt m \leqslant 60\)
16
\(60 \lt m \leqslant 70\)
20
\(70 \lt m \leqslant 80\)
8
\(80 \lt m \leqslant 90\)
7
(a) On the grid, draw a cumulative frequency graph. [3 marks]
(b) Use your graph to estimate the lowest mark of the top 20% of students. [2 marks]
Mark scheme (a)
Answer
Mark
Comments
(9) 25 45 53 60
B1
cumulative frequencies May be implied by points plotted (\(\pm\) 0.5 square)
Points plotted with upper class boundaries and cf values (\(\pm\)0.5 square)
B1ft
ft their cumulative frequencies Must be increasing and not a single straight line
Smooth curve or polygon starting at correct point for their points and going through all their points (\(\pm\)0.5 square)
B1ft
ft their cumulative frequencies Must be increasing and not a single straight line
Additional guidance
Graphs may start from their first plotted point or from (40, 0) If they have plotted their points at mid-points, with point at (45, 9), their graph may start at (35, 0) Graph starting at (0, 0), but otherwise correct
B1B1B0
Curve plotted at mid-points or lower class boundaries, but otherwise correct
B1B0B1
Ignore the graph after \(m = 90\)
Bars drawn as well as correct graph
B1B1B0
Bars drawn without the correct graph
max B1
Mark scheme (b)
Answer
Mark
Comments
Alternative method 1
\(60 - 0.2 \times 60\) or \(60 \times 0.8\) or 48
M1
oe implied by horizontal line from 48 on vertical axis
Correct reading from their increasing graph
A1ft
\(\pm\,\dfrac{1}{2}\) square
Alternative method 2
\(70 + \dfrac{3}{8} \times 10\)
M1
[73, 75]
A1
Additional guidance
The correct answer is likely to be [73, 75] from a correct graph