
Higher November 2024 Paper 2 Q13
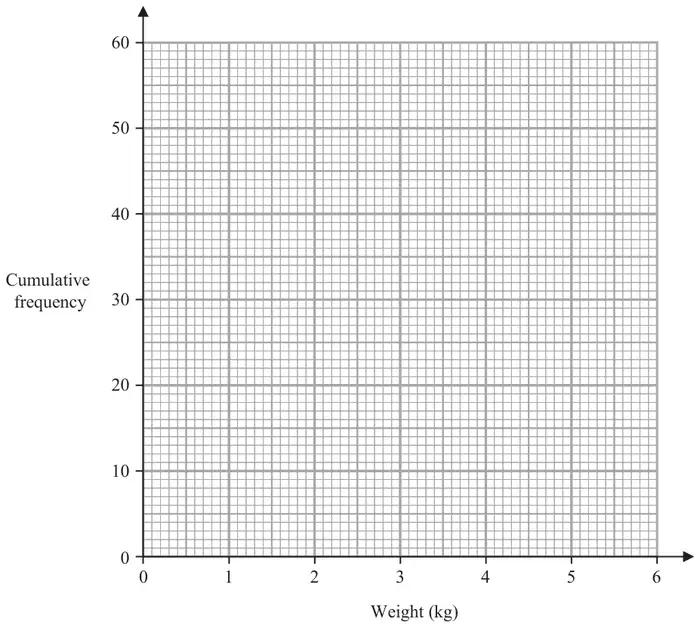
13 The frequency table gives information about the weights, in kilograms, of 60 parcels in a delivery van.
| Weight (\(w\) kilograms) | Frequency |
|---|---|
| \(0 \lt w \leqslant 1\) | 4 |
| \(1 \lt w \leqslant 2\) | 15 |
| \(2 \lt w \leqslant 3\) | 20 |
| \(3 \lt w \leqslant 4\) | 11 |
| \(4 \lt w \leqslant 5\) | 6 |
| \(5 \lt w \leqslant 6\) | 4 |
| Weight (\(w\) kilograms) | Cumulative frequency |
|---|---|
| \(0 \lt w \leqslant 1\) | |
| \(0 \lt w \leqslant 2\) | |
| \(0 \lt w \leqslant 3\) | |
| \(0 \lt w \leqslant 4\) | |
| \(0 \lt w \leqslant 5\) | |
| \(0 \lt w \leqslant 6\) |
| Scheme | Marks |
|---|---|
| 4, 19, 39, 50, 56, 60 | B1 |
| (1) |
| Scheme | Marks |
|---|---|
| B2 | |
| (2) |
Notes
B2: (use overlay) Fully correct cf graph – points at ends of intervals and joined with curve or line segments.
If not B2 then B1(ft from a table with only one arithmetic error that may be continued through table) for 5 or 6 of their points at ends of intervals and joined with curve or line segments
OR for 5 or 6 points plotted correctly at ends of intervals not joined OR for 5 or 6 points from table plotted consistently within each interval (not at upper ends of intervals) at their correct heights and joined with smooth curve or line segments.
(ignore part from 0 to first plotted point when looking at curve/line segments)
| Scheme | Marks |
|---|---|
| ft an increasing graph as student is asked to ‘use your graph…’ Answer: 2.3 – 2.7 | B1ft |
| (1) |
Notes
B1ft: Any value in range if an increasing graph is drawn
(ft their graph reading across at 30 or 30.5)
| Scheme | Marks |
|---|---|
| ft an increasing graph (if reading can be taken) as student is asked to ‘use your graph…’ | M1 |
| If a correct graph is drawn and answer is in the given range, then award the marks Answer: 12, 13, 14 or 15 | A1ft |
| (2) | |
| (6 marks) |
Notes
M1: For a correct method to take a reading at 3.7 kg
eg 45 – 48 or a correct value for their graph
(one square tolerance)
A1ft: Award full marks for an answer in the range if a correct cf graph is drawn and ft their increasing graph if value outside range
Must be a whole number value (non-integer value gains M1 only)