
Higher June 2025 Paper 1R Q12
12 The table gives information about the ages of 80 people in a cinema.
| Age (\(n\) years) | Frequency |
|---|---|
| \(10 \lt n \leqslant 20\) | 12 |
| \(20 \lt n \leqslant 30\) | 15 |
| \(30 \lt n \leqslant 40\) | 20 |
| \(40 \lt n \leqslant 50\) | 18 |
| \(50 \lt n \leqslant 60\) | 9 |
| \(60 \lt n \leqslant 70\) | 6 |
| Age (\(n\) years) | Cumulative frequency |
|---|---|
| \(10 \lt n \leqslant 20\) | |
| \(10 \lt n \leqslant 30\) | |
| \(10 \lt n \leqslant 40\) | |
| \(10 \lt n \leqslant 50\) | |
| \(10 \lt n \leqslant 60\) | |
| \(10 \lt n \leqslant 70\) |
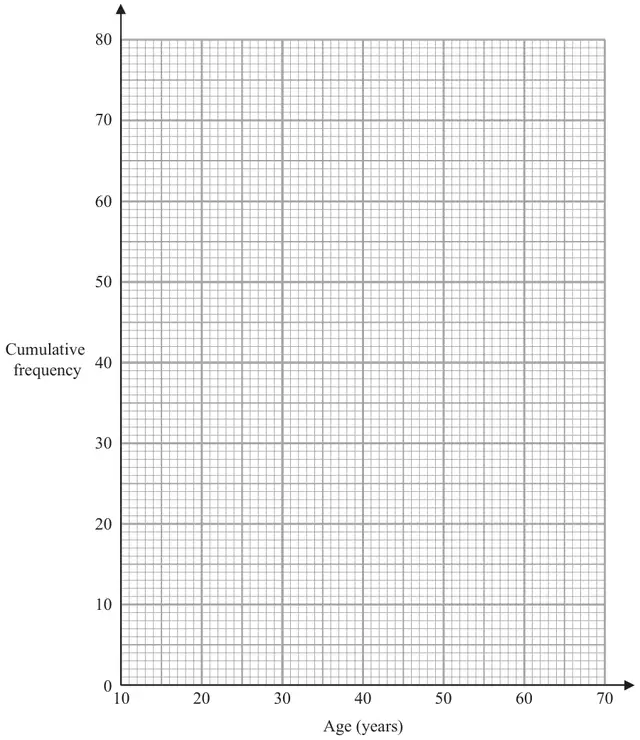
Give your answer correct to the nearest whole number. (3)
| Scheme | Marks |
|---|---|
| 12, 27, 47, 65, 74, 80 | B1 |
| (1) |
| Scheme | Marks |
|---|---|
| M1 | |
| Correct answer scores full marks (unless from obvious incorrect working) Answer: correct cf graph | A1 |
| (2) |
Notes
M1: ft from table for at least 5 points plotted correctly at end of interval or ft from sensible table (ft from a table with only one arithmetic error that may be continued through table) for all 6 points plotted consistently within each interval in the freq table at the correct height
A1: accept curve or line segments
accept curve that is not joined at (10, 0)
| Scheme | Marks |
|---|---|
| M1ft | |
eg (over 46 =) \(\dfrac{80 - \text{``}{58}\text{''}}{80}(\times 100)(= 0.275)\) or (under 46 =) \(\dfrac{\text{``}{58}\text{''}}{80}(\times 100)(= 0.725 \text{ or } 72.5)\) | M1ft |
| Correct answer scores full marks (unless from obvious incorrect working) Answer: 28 | A1ft |
| (3) | |
| (6 marks) |
Notes
M1ft: a line up from 46 to their graph and a line across to the vertical axis or a mark on the curve at the correct point and a mark on the vertical axis at the correct point or a reading of 57 - 59 from their cf graph or a value of 21 – 23 or a correct value for their graph must be ascending (could be a lobf)
M1ft: method to find the fraction or percentage of people aged over or under 46 ft from their graph or a value in the range 0.26 - 0.29 or 0.71 - 0.74 or 71 (%) - 74(%)
A1ft: accept 26 – 29, ft their cf graph