
Higher June 2025 Paper 2 Q13
13 The frequency table gives information about the times, in minutes, that 60 people took to complete a puzzle.
| Time (\(t\) minutes) | Frequency |
|---|---|
| \(0 \lt t \leqslant 10\) | 8 |
| \(10 \lt t \leqslant 20\) | 13 |
| \(20 \lt t \leqslant 30\) | 12 |
| \(30 \lt t \leqslant 40\) | 17 |
| \(40 \lt t \leqslant 50\) | 7 |
| \(50 \lt t \leqslant 60\) | 3 |
| Time (\(t\) minutes) | Cumulative frequency |
|---|---|
| \(0 \lt t \leqslant 10\) | |
| \(0 \lt t \leqslant 20\) | |
| \(0 \lt t \leqslant 30\) | |
| \(0 \lt t \leqslant 40\) | |
| \(0 \lt t \leqslant 50\) | |
| \(0 \lt t \leqslant 60\) |
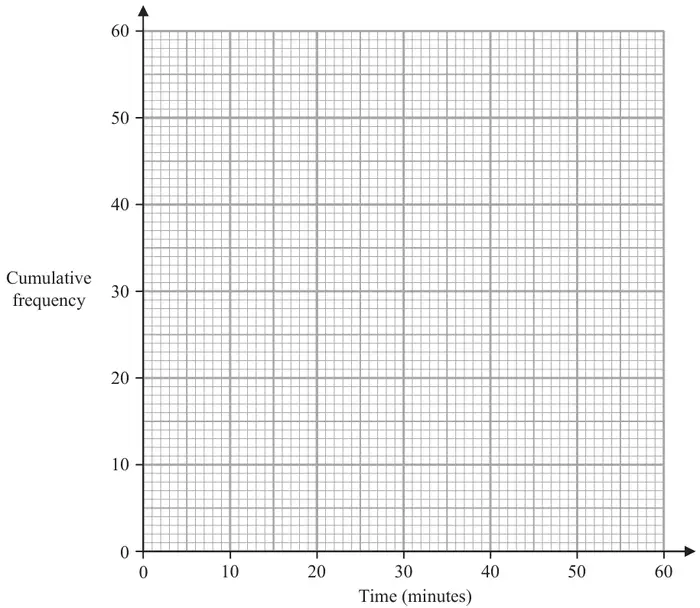
| Scheme | Marks |
|---|---|
| 8, 21, 33, 50, 57, 60 | B1 |
| (1) |
| Scheme | Marks |
|---|---|
| USE OVERLAY (NB A histogram/bar chart type graph scores zero marks unless a CF diagram is drawn over their histogram/bar chart) (Ignore any part of the graph before (10, 8)) | M1 |
| Working not required, so correct answer scores full marks (unless from obvious incorrect working) Answer: Correct cf diagram | A1 |
| (2) |
Notes
M1: for at least 5 points plotted correctly at end of interval
or
ft from an ascending table (ft from a table with only one arithmetic error that may be continued through table) for all 6 points plotted consistently within each interval in the freq table at the correct height
A1: for fully correct plotting with points joined
accept curve or line segments
accept curve that is not joined at (0, 0)
| Scheme | Marks |
|---|---|
| 27 – 28 | B1 |
| (1) |
Notes
B1: accept answer in the range
or
ft an ascending graph
| Scheme | Marks |
|---|---|
| (60 –) 54 | M1 |
| Working not required, so correct answer scores full marks (unless from obvious incorrect working) Answer: 5 or 6 or 7 | A1 |
| (2) | |
| (6 marks) |
Notes
M1: ft for a line going up from the \(x\)-axis at 45 to the line and across to the \(y\)-axis
or
for a mark on the line at the correct point
or
for a correct reading from the vertical scale eg 54 or 53.5
A1: accept integer value 5 or 6 or 7
or
ft from their ascending graph for an integer value