
Higher June 2025 Paper 1 Q17
17 The histogram shows information about the times, in minutes, that some people were in a shop.
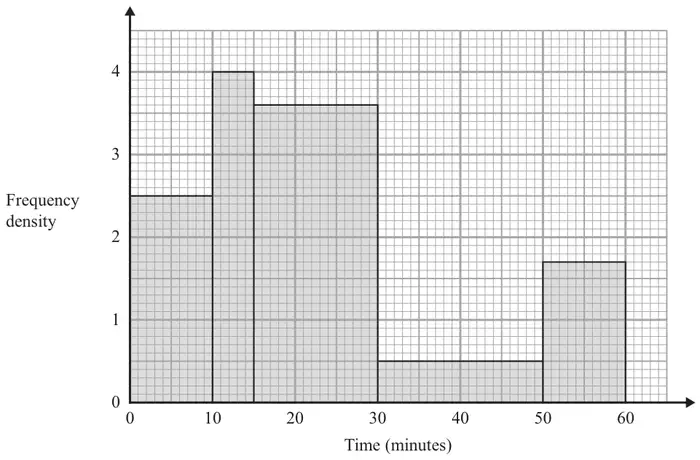
Work out an estimate for the proportion of these people who were in the shop for more than 40 minutes.
(3)
| Scheme | Marks |
|---|---|
| freq density × mins 10 × 2.5 (= 25) 5 × 4 (= 20) 15 × 3.6 (= 54) 20 × 0.5 (= 10) 10 × 1.7 (= 17) 10 × 0.5 (= 5) (area of 40 to 50 bar) or counting small squares 10 × 25 (= 250) 5 × 40 (= 200) 15 × 36 (= 540) 20 × 5 (= 100) 10 × 17 (= 170) 10 × 5 (= 50) (area of 40 to 50 bar) or counting cm2 2 × 5 (= 10) 1 × 8 (= 8) 3 × 7.2 (= 21.6) 4 × 1 (= 4) 2 × 3.4 (= 6.8) 2 × 1 (= 2) (area of 40 to 50 bar) | M1 |
| (10 × 2.5) + (5 × 4) + (15 × 3.6) + (20 × 0.5) + (10 × 1.7) (= 126) or “25” + “20” + “54” + “10” + “17” (= 126) or “250” + “200” + “540” + “100” + “170” (= 1260) or “10” + “8” + “21.6” + “4” + “6.8” (= 50.4) | M1 |
Correct answer scores full marks (unless from obvious incorrect working) Answer: \(\dfrac{11}{63}\) | A1 |
| (3) | |
| (3 marks) |
Notes
M1: for finding the area of at least 2 bars
either using freq density × mins
or
use of counting small squares or cm2
Values may be seen on the diagram
22 or 220 or 8.8 implies M1
M1: for method to find total number of people (allow one error or omission)
or
total number of small squares/ cm2 for method used (allow one error or omission)
A1: oe eg \(\dfrac{22}{126}\) or \(\dfrac{220}{1260}\) or 0.174(60…) or 0.175 or 17.4(60…)% or 17.5%
or 22 out of 126
If \(\dfrac{22}{126}\) is seen in the workings and 22 is on the answer line, award M2A0