
Higher November 2024 Paper 1 Q18
18 The histogram shows information about the times some students took to complete a puzzle.
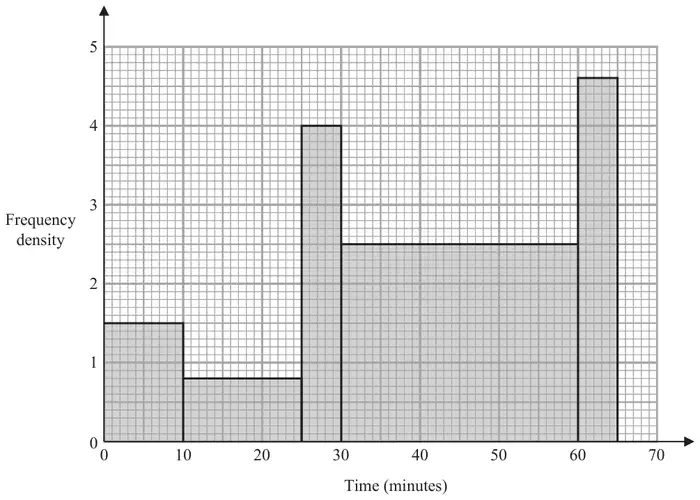
Work out an estimate for the fraction of these students who took between 20 minutes and 60 minutes to complete the puzzle.
(4)
| Scheme | Marks |
|---|---|
| eg two from 1.5 × 10 (= 15) or 0.8 × 15 (= 12) or 4 × 5 (= 20) or 2.5 × 30 (= 75) or 4.6 × 5 (= 23) or eg two from 15 or 12 or 20 or 75 or 23 or eg two from 150 or 120 or 200 or 750 or 230 or eg two from 6 or 4.8 or 8 or 30 or 9.2 | M1 |
eg 1.5 × 10 + 0.8 × 15 + 4 × 5 + 2.5 × 30 + 4.6 × 5 (= 145) or 15 + 12 + 20 + 75 + 23 (= 145) or 150 + 120 + 200 + 750 + 230 (= 1450) 6 + 4.8 + 8 + 30 + 9.2 (= 58) or \(\dfrac{1}{3} \times \text{“}12\text{”} + \text{“}20\text{”} + \text{“}75\text{”}\;(= 99)\) 4 + 20 + 75 (= 99) | M1 |
eg \(\dfrac{0.8 \times 5 + \text{“}20\text{”} + \text{“}75\text{”}}{\text{“}15\text{”} + \text{“}12\text{”} + \text{“}20\text{”} + \text{“}75\text{”} + \text{“}23\text{”}}\) or \(\dfrac{\tfrac{1}{3} \times \text{“}12\text{”} + \text{“}20\text{”} + \text{“}75\text{”}}{\text{“}145\text{”}}\) or \(\dfrac{\tfrac{1}{3} \times \text{“}120\text{”} + \text{“}200\text{”} + \text{“}750\text{”}}{\text{“}1450\text{”}}\) or \(\dfrac{\tfrac{1}{3} \times \text{“}4.8\text{”} + \text{“}8\text{”} + \text{“}30\text{”}}{\text{“}58\text{”}}\left(= \dfrac{39.6}{58}\right)\) | M1 |
Correct answer scores full marks (unless from obvious incorrect working) Answer: \(\dfrac{99}{145}\) | A1 |
| (4) | |
| (4 marks) |
Notes
M1: for at least two correct frequencies
or
for counting squares or blocks
M1: for a method to find the number of students in each time interval with an intention to add
Allow one error
or
for a method to find the total number of squares or blocks oe with an intention to add
Allow one error
or
for a correct method to find the frequency between 20 and 60 minutes eg 4 + 20 + 75
M2 for a value of 99 for 20 – 60 minute interval
M1: for a complete method
Allow the one error in the previous M mark to follow through
A1: oe but must be a fraction