
Higher November 2024 Paper 1 Q7
7 The graph shows the volume of water, \(V\) litres, in a tank at time \(t\) seconds.
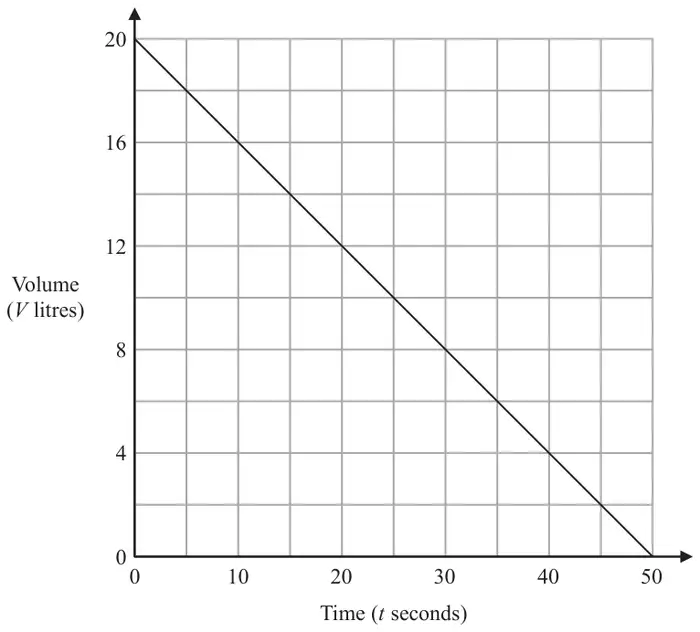
What does the gradient of this graph represent? (1)
| Answer | Mark | Mark scheme |
|---|---|---|
| Rate of change of volume | C1 | for a correct explanation Acceptable examples The rate of water poured Speed of pouring water out from the tank How fast the water is being used (in the tank over time) Amount of water decreasing in the tank each second Not acceptable examples Negative correlation / negative gradient Amount of water decreasing in the tank in seconds As time increases the volume of water in the tank decreases It is negative, the volume of litres is going down It represents the deceleration or changing speed |
Additional guidance
Allow amount of water increasing in the tank each second