
Foundation June 2025 Paper 1 Q4
4 Ola and Pip make orange paint by mixing red paint and yellow paint.
The graph shows how much of each colour paint to use.
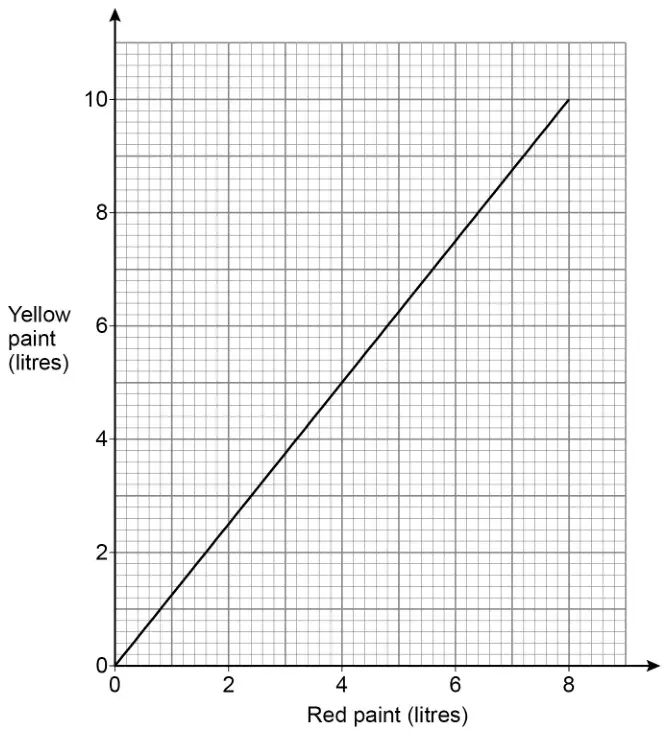
(a) Ola uses 5 litres of yellow paint.
Write down how much red paint Ola uses. [1 mark]
(b) Pip uses 10 litres of yellow paint.
How much orange paint does Pip make? [2 marks]
| Answer | Mark | Comments |
|---|---|---|
| [3.9, 4.1] | B1 |
| Answer | Mark | Comments |
|---|---|---|
| Alternative method 1: reads off at ‘10’ from graph | ||
| [17.9, 18.1] | B2 | B1 [7.9, 8.1] or their reading \(+\) 10 |
| Alternative method 2: uses their answer to part (a) | ||
| \(2 \times\) their (a) or (their (a) \(+\) 5) \(\times\) 2 | M1 | oe |
| [17.9, 18.1] | A1ft | ft \(2 \times\) their (a) \(+\) 10 |