
AS June 2018 Q3
3.
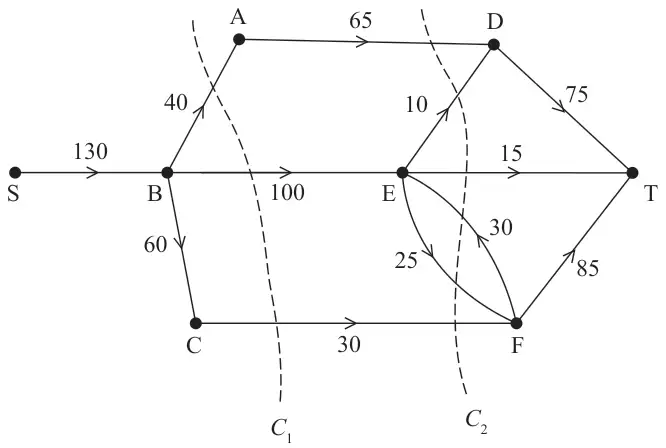
Figure 1 models the flow of fluid through a system of pipes from a source, S, to a sink, T.
The weights on the arcs show the capacities of the corresponding pipes in litres per minute.
Two cuts \(C_1\) and \(C_2\) are shown.
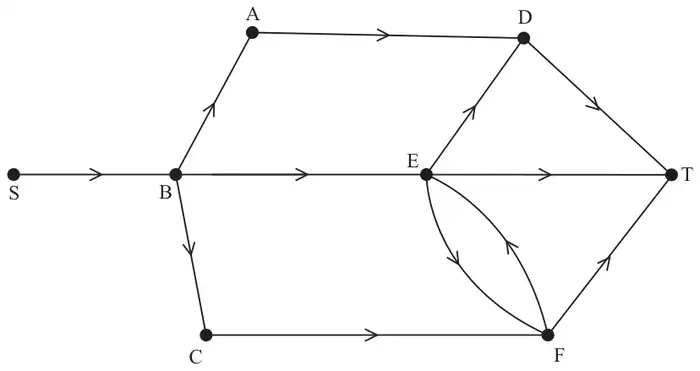
A new pipe is planned from S to A. Let the capacity of this pipe be \(x\) litres per minute.
| Scheme | Marks | AO |
|---|---|---|
| (i) 170 (ii) 145 | B1 B1 | 1.1b 1.1b |
| (2) |
Notes
(i) B1: cao
(ii) B1: cao
| Scheme | Marks | AO |
|---|---|---|
| Deduces the maximum possible flow is \(\leqslant 145\) litres per minute | B1ft | 2.2a |
| (1) |
Notes
B1ft: deduced from their least value given in (a) - must include ‘less than or equal to’
| Scheme | Marks | AO |
|---|---|---|
 | M1 A1 | 2.2a 1.1b |
| (2) |
Notes
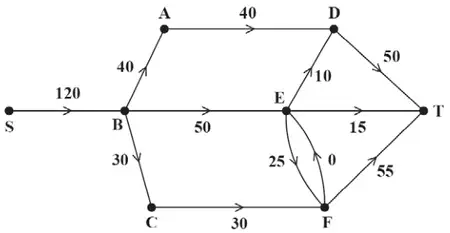
M1: deduces that the flow out of SB must equal 120 and that the ‘flow in = flow out’ at all but one node – one number only required on each arc (condone blank for arc FE)
A1: a correct valid flow through the network (check that flow in must equal flow out at each vertex)
| Scheme | Marks | AO |
|---|---|---|
| Cut through arcs BA, ED, ET, EF (twice), CF | B1 | 3.1a |
| Maximum flow = minimum cut Flow = 120, Cut = 120 therefore flow of 120 is optimal | B1 | 2.1 |
| (2) |
Notes
B1: finds a correct cut through saturated arcs directed from S to T
B1: correct mathematical argument that the maximum flow is 120 - dependent on correct cut and correct flow in (c) – must state ‘maximum flow = minimum cut’
| Scheme | Marks | AO |
|---|---|---|
| \(0 \lt x \leqslant 25, \qquad\) flow is \(120 + x\) \(x \gt 25, \qquad\qquad\ \ \) flow is \(145\) | M1 A1 A1 | 3.1a 2.2a 2.3 |
| (3) | ||
| (10 marks) |
Notes
M1: understanding that the flow through the system will be different depending on the possible values of \(x\) (this could be shown by either of the flows being stated correctly or by consideration of the critical value of \(x = 25\))
A1: correct deduction of both possible flows: \(120 + x\) and 145
A1: correct argument (in terms of the correct inequalities) for when the flow is valid for \(120 + x\) and 145
SC in (e) – award M1A1 for one correct flow and interval