
AS June 2023 Paper 1 Q5
5.
In this question you must show all stages of your working.
Solutions relying on calculator technology are not acceptable.
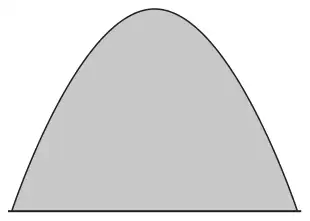
A large pile of concrete waste is created on a building site.
Figure 1 shows a central vertical cross-section of the concrete waste.
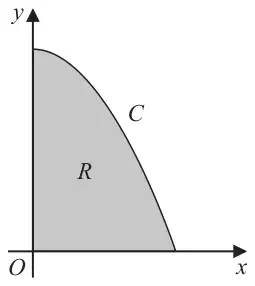
The curve \(C\), shown in Figure 2, has equation
\[y + x^2 = 2 \qquad 0 \leqslant x \leqslant \sqrt{2}\]The region \(R\), shown shaded in Figure 2, is bounded by the \(y\)-axis, the \(x\)-axis and the curve \(C\).
The volume of concrete waste is modelled by the volume of revolution formed when \(R\) is rotated through 360° about the \(y\)-axis. The units are metres.
The density of the concrete waste is 900 kg m−3
The mass of the concrete waste is approximately 5500 kg.
| Scheme | Marks | AO |
|---|---|---|
| \(\{V =\}\ \pi\displaystyle\int_0^2 \left[(2 - y)^{\frac{1}{2}}\right]^2 \mathrm{d}y\) or \(\{V =\}\ \pi\displaystyle\int_0^2 (2 - y)\,\mathrm{d}y\) | B1 | 3.3 |
| Integrates to the form \(\alpha y \pm \beta y^2\) | M1 | 1.1b |
| Correct integration \(2y - \dfrac{1}{2}y^2\) | A1 | 1.1b |
| Uses their \(y\) limits correctly in a changed expression \(\pi\left[2y - \dfrac{1}{2}y^2\right]_0^2 = \pi\left(2(2) - \dfrac{1}{2}\left(2^2\right)\right) - 0 = \ldots\{2\pi \text{ or } 6.28\ldots\}\) | M1 | 3.4 |
| mass = ‘their volume’ × 900 | M1 | 3.1b |
| Mass = 5700 (kg) 2 s.f. cao | A1 | 2.2b |
| (6) |
Notes
B1: Sets up the model to find a correct expression for the volume, including limits, d\(y\) may be implied. The limits may be seen later.
M1: Integrates to the form \(\alpha y \pm \beta y^2\)
A1: Correct integration
M1: Substitutes their \(y\) limits the correct way round and subtracts, must be a changed expression
M1: Multiplies their volume by 900 to find the mass
A1: 5700 cao
Note incorrect upper limit of \(\sqrt{2}\) leads to 5200kg Scores B0 M1 A1 M1 M1 A0
Note: Finding the volume around the \(x\)-axis can score B0 M0 A0 M0 M1 A0 only
Note If they use their calculator to find the value of the definite integration and achieve the correct answer the maximum they can score is B1M0A0M1M1A1
| Scheme | Marks | AO |
|---|---|---|
| eg The surface will not be smooth The pile will not follow the shape of the curve The pile will not be solid Equation of the curves may not be a suitable model Concrete is likely to be uneven/may have bumps The pile is unlikely to be symmetrical | B1 | 3.5b |
| (1) |
Notes
B1: See scheme, must be referring to the model and not the value of the density etc
| Scheme | Marks | AO |
|---|---|---|
| Makes a comparison about the difference between their mass and 5500 and draws a conclusion e.g. 200 difference which is a lot of concrete therefore not a good model e.g. the mass of 5700 is very close to 5500 kg and draws a conclusion about the model – e.g. therefore a good model e.g. Finds the percentage error and draw a conclusion about the model e.g. The masses are very close/significantly different and draws an appropriate conclusion Not sufficient to say 5700 > 5500 B0 | B1ft | 3.5a |
| (1) | ||
| (8 marks) |
Notes
B1ft: See scheme, follow through on their answer to (a). If using a calculation, it must be correct. Ignore any contradictory comments e.g. 3.6% out so it’s fairly close so it’s a good model but it’s an overestimate which isn’t good. You may need to use your own judgement but any sensible comment comparing their value to 5500 is acceptable.