
AS June 2022 Q2
2. The graph shows the probability density function \(\mathrm{f}(x)\) of the continuous random variable \(X\)
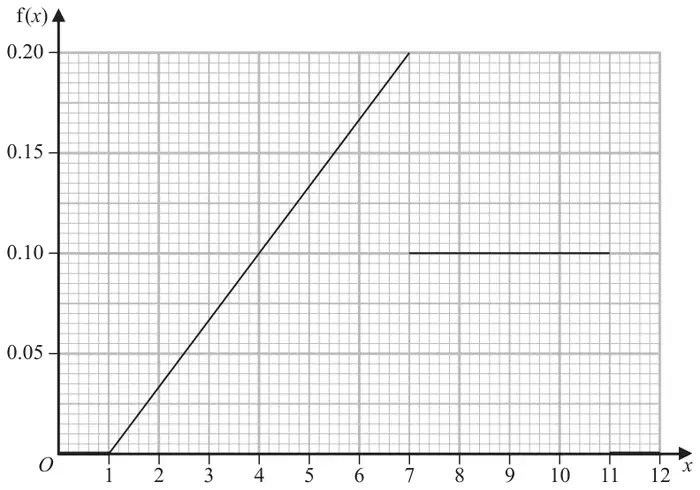
(a) Find \(\mathrm{P}(X \lt 4)\) (2)
(b) Specify the cumulative distribution function of \(X\) for \(7 \leqslant x \leqslant 11\) (3)
| Scheme | Marks | AO |
|---|---|---|
| \(\mathrm{P}(X \lt 4) = \dfrac{(4-1) \times 0.1}{2}\) or \(\displaystyle\int_1^4 \tfrac{1}{30}(x-1)\,\mathrm{d}x\) | M1 | 2.1 |
| \(= 0.15\) | A1 | 1.1b |
| (2) |
Notes
M1: Use of area of triangle or integration with limits to find required area
Condone \(\dfrac{4 \times 0.1}{2}\) or \(\displaystyle\int_1^4 \tfrac{1}{30}(x)\,\mathrm{d}x\) for M1
A1: 0.15 oe
| Scheme | Marks | AO | |||
|---|---|---|---|---|---|
| M1 M1 | 3.1a 1.1b | |||
| \(\mathrm{F}(x) = 0.1x - 0.1\) [for \(7 \leqslant x \leqslant 11\)] | A1 | 1.1b | |||
| (3) | |||||
| (5 marks) |
Notes
M1: Complete method for finding the cdf including area from \(1 \leqslant x \lt 7\)
Condone one slip for the area from \(1 \leqslant x \lt 7\)
M1: Attempt at area from \(7 \leqslant x \leqslant 11\)
A1: \(0.1x - 0.1\)